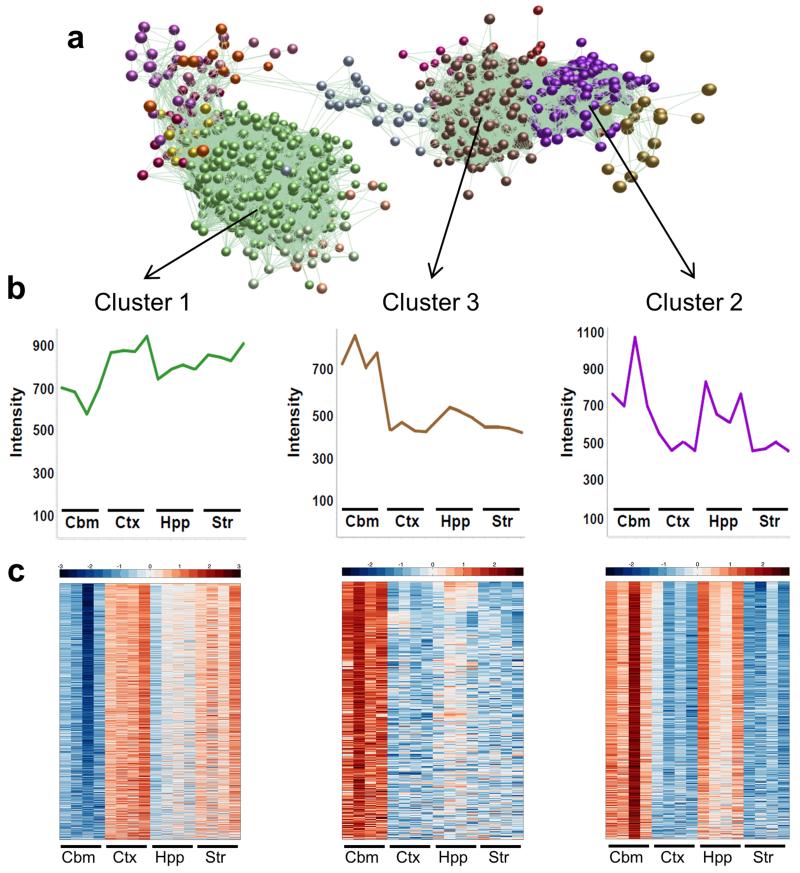
Figure 3.
Three major patterns of gene co-expression underpin regional microglial transcriptional heterogeneity. (a) A transcript-to-transcript correlation network graph of transcripts significantly differentially expressed by brain region was generated in BioLayout Express3D (Pearson correlation threshold r ≥ 0.80). Nodes represent transcripts (probesets) and edges the degree of correlation in expression pattern between them. The network graph was clustered using a Markov clustering algorithm and transcripts assigned a colour according to cluster membership. Three major clusters were identified. (b) Mean expression profile of all transcripts within clusters 1, 2 and 3. (c) Heat maps showing the expression profile of all transcripts contained within clusters 1, 2 and 3. Each probeset is represented in a blue-red row Z-score scale with red indicating high expression and blue low expression. Str, striatum; Hpp, hippocampus; Ctx, cerebral cortex; Cbm, cerebellum.

