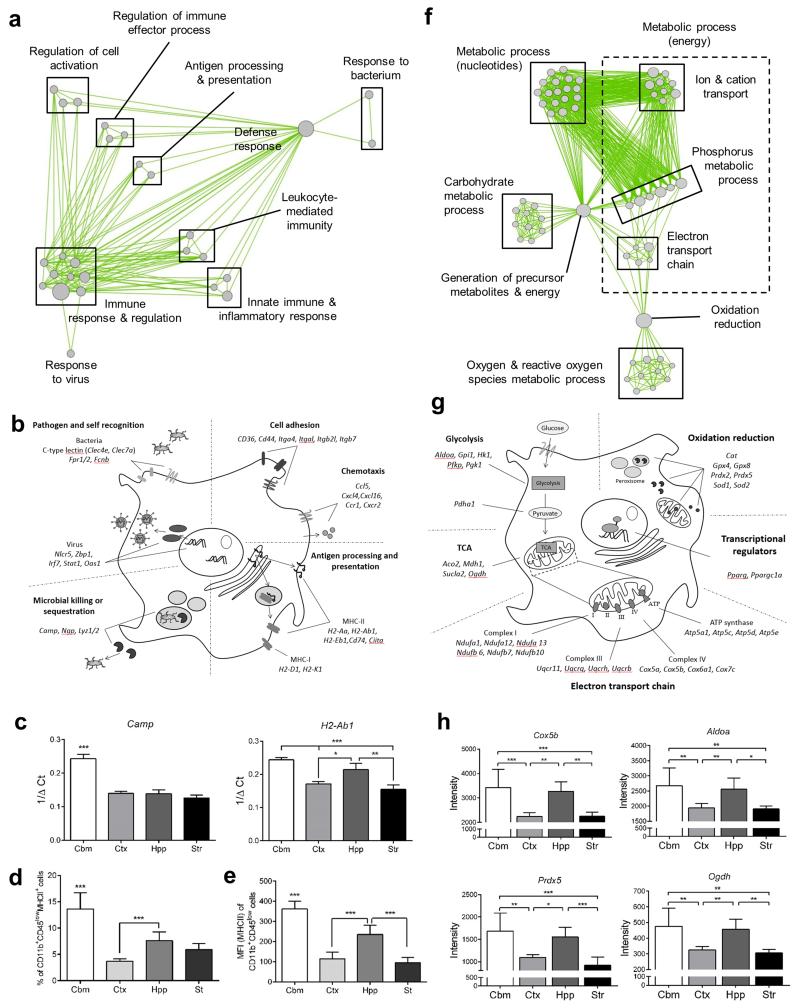
Figure 4.
Regional transcriptional heterogeneity in microglial immunophenotype and bioenergetics. (a) Cluster 3 transcripts were analysed for enrichment of Gene Ontology (GO) Biological Processes in DAVID (p < 0.05 with Benjamini correction) and a network graph of enriched GO terms generated in Enrichment Map. Nodes represent individual GO terms (gene sets) and edges the relatedness between them. (b) Examples of individual genes in cluster 3 manually annotated to functional categories of immunoregulatory function. (c) mRNA expression of selected genes in purified microglia measured by quantitative PCR. Data show mean ± SD, n = 4 independent samples, each from tissue pooled from eight mice. *p < 0.05, **p < 0.01, ***p < 0.001, one-way ANOVA with Bonferroni correction. (d, e) Expression of MHC-II protein was measured by flow cytometry on freshly isolated adult microglia identified by CD11b+CD45lo profile in mixed brain cell suspensions from discrete brain regions. Data show (d) proportion of CD11b+CD45lo microglia positive for MHC-II and (e) mean fluorescence intensity of MHC-II expression on CD11b+CD45lo cells. Data show mean ± SD, n = 3 independent cell preparations. ***p < 0.001, one-way ANOVA with Bonferroni correction. (f) Cluster 2 transcripts were analysed for enrichment of GO Biological Processes (p < 0.05 with Benjamini correction) and a network graph of enriched GO terms generated in Enrichment Map. (g, h) Examples of individual genes in cluster 2 manually annotated to functional categories of bioenergetic function. Data show mean ± SD, n = 4 independent samples, each from tissue pooled from eight mice. *p < 0.05, **p < 0.01, ***p < 0.001, one-way ANOVA with Bonferroni correction. Str, striatum; Hpp, hippocampus; Ctx, cerebral cortex; Cbm, cerebellum. Specific p values for all statistical comparisons are presented in Supplementary Table 13.

