Figure 7.
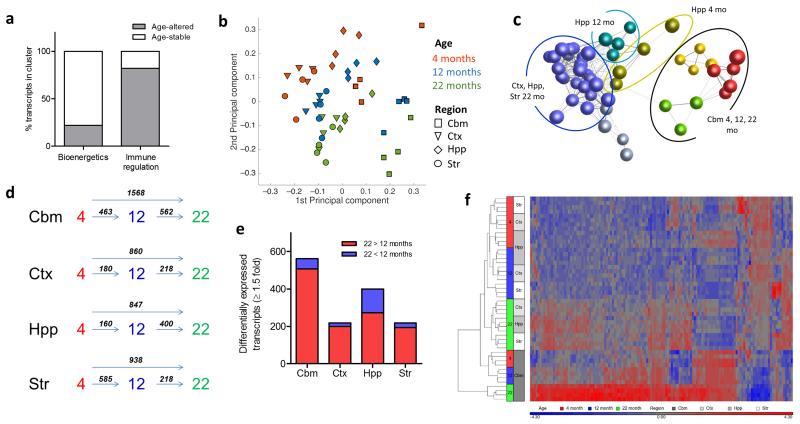
Region-specific microglial ageing. (a) Transcripts within the 4 months old immunoregulatory and bioenergetics clusters (see Fig 3) were assessed for age-regulated differential expression and the proportion of age-stable and age-altered transcripts determined. (b) Principal components analysis plot of microarray expression profiles for purified microglia from discrete brain regions at 4, 12 and 22 months of age. (c) Sample-to-sample correlation network graph of microarray datasets was performed in BioLayout Express3D and clustered using a Markov clustering algorithm. Nodes represent individual samples and edges the degree of correlation between their expression patterns. Colours denote discrete clusters. (d) Comparison of the number of differentially expressed transcripts (p < 0.05 with FDR correction, fold change ≥ 1.5) between different ages for each brain region. (e) Comparison of the number of up-regulated and down-regulated transcripts (p < 0.05 with FDR correction, fold change ≥ 1.5) at 22 vs 12 months in each brain region. (f) Hierarchical clustering and heat map of top transcripts with significant age-region interaction (p < 0.05, two-way ANOVA with FDR correction). The scaled expression value (row Z-score) is displayed in a blue-red colour scheme with red indicating higher expression and lower expression in blue. Str, striatum; Hpp, hippocampus; Ctx, cerebral cortex; Cbm, cerebellum.

