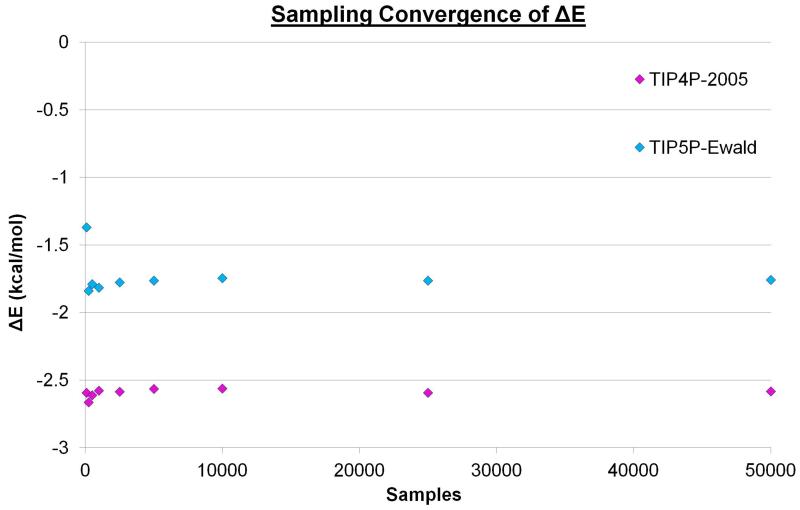
Figure 3. The convergence of ΔE with increased sampling.
The calculated enthalpy of the first hydration site for TIP4P-2005 (magenta) and TIP5P-Ewald (cyan) using different levels of sampling from the 2,000,000 configurations. For the nine points plotted for each water model 100, 250, 500, 1000, 2500, 5000, 10,000, 25,000, and 50,000 samples were taken.

