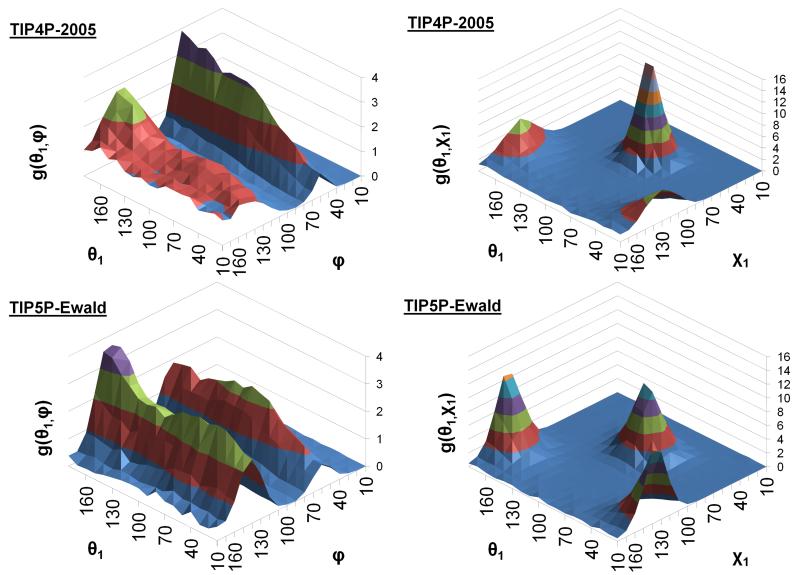
Figure 9. Surface plots of the θ1/χ1 and θ1/φ angular distribution functions for the two models.
The θ1/θ2 and θ1/φ pair distribution functions for the two models between 2.7 Å and 2.8 Å. The probability densities g(θ1/θ2) and g(θ1/φ) are represented by the level of the surface and coloured in bands of height of 2.0 and 1.0 respectively.

