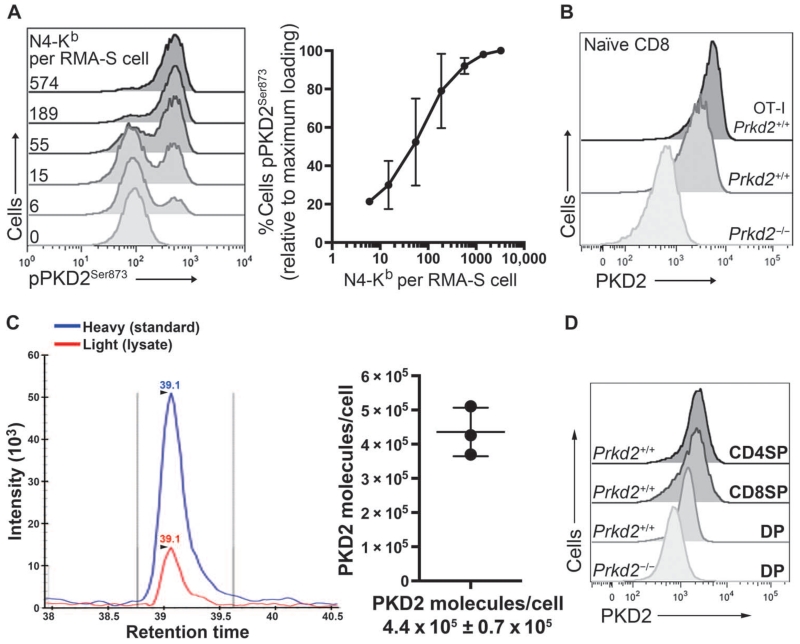
Fig. 2. PKD2 is a sensitive amplifier of TCR signaling.
(A) Naïve OT-I CD8+ T cells were stimulated for 2 hours with RMA-S loaded with the indicated amounts of N4 peptide and then assessed by flow cytometry. Representative histograms show pPKD2Ser873 staining. Inset: numbers indicate the number of pMHC complexes (N4-Kb) presented on the surface of each RMA-S cell. Graph shows the mean percentage ± SD of cells that were positive for pPKD2Ser873 relative to the percentage of cells that occurred with the maximal dose of pMHC. Data are from three independent experiments. (B) Flow cytometric analysis of PKD2 abundance in naïve OT-I CD8+ T cells and polyclonal CD8+ T cells with anti-PKD2 antisera. Staining of Prkd2−/− cells is shown as a negative control for antisera specificity. Histograms are representative of two independent experiments. (C) Absolute quantification of PKD2 in naïve OT-I CD8+ T cells as assessed by SRM. Histogram shows the peak intensities of co-eluted light (endogenous) and heavy (standard) PKD2654–664 peptides. Peak intensities of six transitions were used to back-calculate the number of PKD2 molecules per cell. Graph indicates the number of PKD2 molecules per cell expressed as an average ± SD. Data are from three biological replicates. (D) Flow cytometric analysis of PKD2 abundance in cells at different stages of development in the thymus in polyclonal mice. Histograms are representative of two independent experiments.

