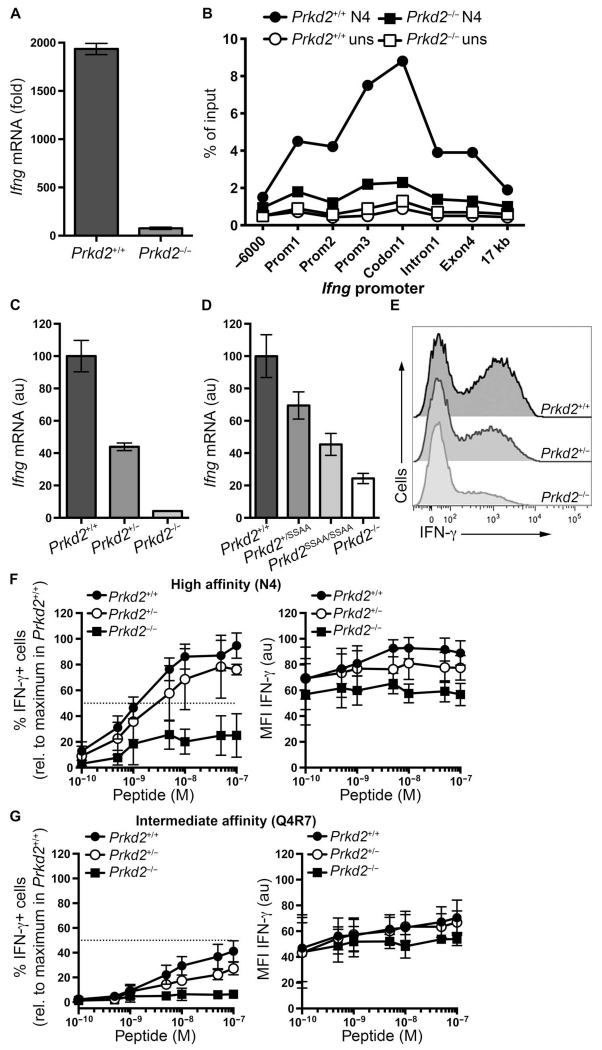
Fig. 4. Effect of PKD2 abundance on IFN-γ production.
(A) Naïve OT-I CD8+ T cells from Prkd2+/+ and Prkd2−/− mice treated with 2 nM N4 peptide for 5 hours were subjected to real-time polymerase chain reaction (PCR) analysis to determine the abundance of Ifng mRNA relative to that in untreated cells. Data are means ± SD of triplicate samples from one experiment and are representative of five independent experiments. (B) Naïve OT-I CD8+ T cells from Prkd2+/+ and Prkd2−/− mice treated with 10 nM N4 peptide for 6 hours were subjected to chromatin immunoprecipitation (ChIP) assays to determine the extent of Pol II binding to the Ifng promoter. Binding is presented as a percentage of input. Data are representative of two independent experiments. (C) Naïve OT-I CD8+ T cells from Prkd2+/+, Prkd2+/−, and Prkd−/− mice treated with 2 nM N4 peptide for 4 hours were subjected to real-time PCR analysis to determine the abundance of Ifng mRNA relative to that in OT-I Prkd2+/+ cells. Data are means ± SD of triplicate samples from one experiment and are representative of three independent experiments. (D) Naïve OT-I CD8+ T cells from Prkd2+/+, Prkd2+/SSAA, Prkd2SSAA/SSAA, and Prkd2−/− mice treated with 2 nM N4 peptide for 4 hours were subjected to real-time PCR analysis to determine the abundance of Ifng mRNA relative to that in OT-I Prkd2+/+ cells. Data are means ± SD of triplicate samples from one experiment and are representative of two independent experiments. (E) Naïve OT-I CD8+ T cells from Prkd2+/+, Prkd2+/−, and Prkd2−/− mice stimulated with 10 nM N4 peptide for 6 hours were subjected to intracellular flow cytometry to determine the abundance of IFN-γ. Histograms are representative of three independent experiments. (F and G) Naïve OT-I CD8+ T cells from Prkd2+/+, Prkd2+/−, and Prkd2−/− mice stimulated for 6 hours with the indicated concentrations of (F) the high-affinity peptide N4 or (G) the intermediate-affinity peptide Q4R7 were analyzed by flow cytometry to determine IFN-γ production. Left: Mean percentages ± SD of cells that were positive for IFN-γ relative to Prkd2+/+ cells treated with the maximum concentration of N4 peptide. Data are from three independent experiments. Right: Means ± SD of the MFI of IFN-γ in positive cells relative to the MFI of IFN-γ in Prkd2+/+ cells treated with the maximum concentration of N4 peptide. Data are from three independent experiments.

