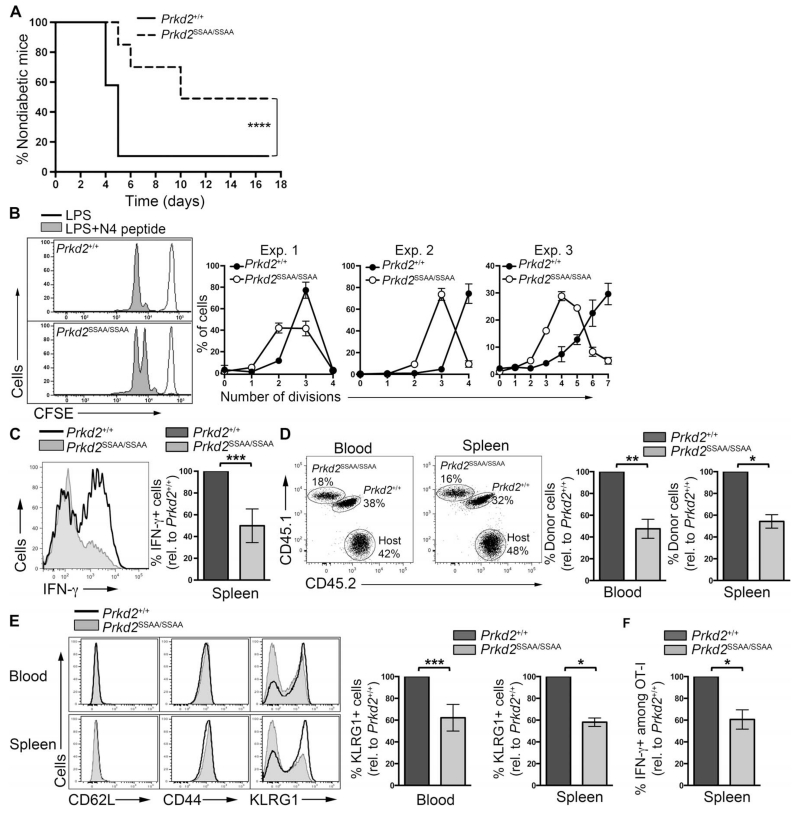
Fig. 5. PKD2 mediates CD8+ T cell–dependent immune responses in vivo.
(A) Diabetes onset in the RIP-mOVA model of autoimmune diabetes. Naïve OT-ICD8+ T cells from Prkd2+/+ and Prkd2SSAA/SSAA mice were adoptively transferred into RIP-mOVA mice before the recipients were immunized with LPS and N4 peptide. Data are from three independent experiments (n = 20 mice). ****P < 0.0001 by log-rank Mantel-Cox test. (B) CFSE dilution in naïve CD8 T cells in vivo. CFSE-labeled naïve OT-I CD8+ T cells isolated from Prkd2+/+ and Prkd2SSAA/SSAA mice were mixed at a 1:1 ratio and adoptively transferred into C57BL/6 recipients before the mice were immunized with LPS with or without N4 peptide. Representative histograms show flow cytometric analysis of CFSE dilution 2 days after immunization. Graphs show the percentages of cells in each division in each of three independent experiments. (C) OT-I CD8+ T cells from Prkd2+/+ and Prkd2SSAA/SSAA mice were mixed and adoptively transferred into C57BL/6 recipients 2 days before they were immunized with LPS and N4 peptide. Seven days after immunization, splenic cells were isolated and stimulated in vitro with N4 peptide for 4 hours. IFN-γ production in OT-I donor cells was assessed by intra-cellular flow cytometric analysis. Histogram compares IFN-γ production in Prkd2+/+ and Prkd2SSAA/SSAA cells and is representative of three experiments. Graph shows the percentage of Prkd2SSAA/SSAA cells positive for IFN-γ relative to Prkd2+/+ cells. Data are from three independent experiments, with three to five mice per experiment. ***P = 0.0002 by Wilcoxon signed rank nonparametric test. (D to F) Naïve OT-I CD8+ T cells from Prkd2+/+ and Prkd2SSAA/SSAA mice were mixed at a 1:1 ratio and adoptively transferred into C57BL/6 recipients before the mice were subjected to L. monocytogenes OVA infection. Seven days later, donor cells were analyzed by flow cytometry. (D) Dot plots show the percentages of OT-I donor cells among the total CD8 population in blood and spleen, as determined by staining with congenic markers. Graphs show the mean percentages ± SD of OT-I Prkd2SSAA/SSAA cells relative to the percentage of OT-I Prkd2+/+ cells. Data are pooled from two independent experiments, with three to six mice per experiment. **P = 0.002 and *P = 0.0156 by Wilcoxon signed rank non-parametric test. (E) Histograms show the relative abundances of CD62L, CD44, and KLRG1 in the indicated donor OT-I cells as determined by flow cytometry. Graphs show the mean percentages ± SD of OT-I Prkd2SSAA/SSAA cells that were positive for KLRG1+ relative to the percentage of OT-I Prkd2+/+ cells that were KLRG1+. Data are pooled data from two independent experiments, with three to six mice per experiment. ***P = 0.001 and *P = 0.0156 by Wilcoxon signed rank nonparametric test. (F) Mean percentages ± SD of OT-I donor cells that were positive for IFN-γ relative to the percentage of OT-I Prkd2+/+ cells that were positive for IFN-γ. Data are pooled from two independent experiments, with three mice per experiment. *P = 0.0156 by Wilcoxon signed rank nonparametric test.

