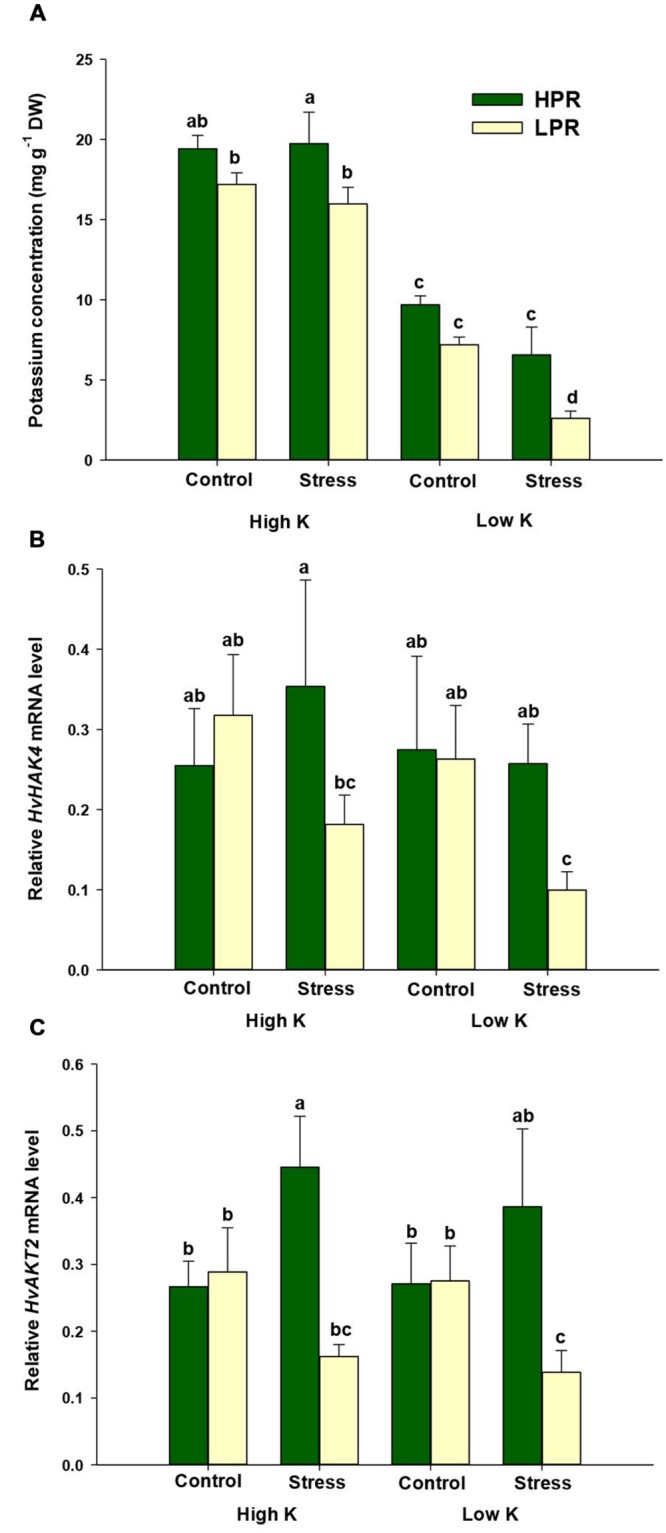
FIGURE 2.

Influence of K supply on K concentrations and gene expression of K transporters in flag leaves of barley during terminal drought stress. (A) K concentrations, (B) relative HvHAK4 mRNA levels, and (C) relative HvAKT2 mRNA levels in flag leaves of the lines HPR and LPR. Plants were pre-cultured under sufficient water supply (control) or water limitation (stress) and under low or high K supply. Flag leaves from 12 weeks-old plants were harvested 12 days after imposing drought stress. Bars indicate mean ± SD. Different letters denote significant differences according to three-way ANOVA and Tukey’s test (p < 0.05; n = 6). Ubi E2-17 (ubiquitin-conjugating enzyme) was used as reference gene.
