
Figure 1.
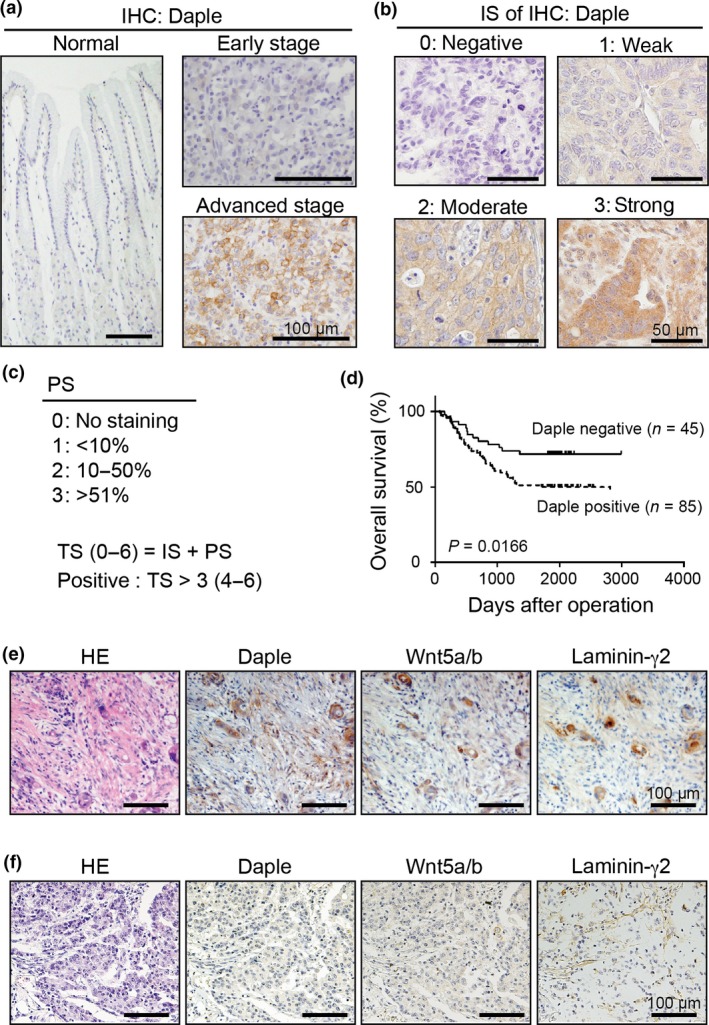
Expression of Daple in gastric cancer. (a) Representative images of immunohistochemical (IHC) staining for Daple. Sections as indicated including an invasive region of the advanced stage of gastric cancer (bottom right) were stained with anti‐Daple antibody. Scale bars, 100 μm. (b) Representative images for representative Daple staining intensity for each intensity score (IS) (0–3). Scale bars, 50 μm. (c) Frequency and distribution of Daple expression was judged with the proportion score (PS) as indicated in the panel. The sum of IS and PS was used as a total score (TS) for the determination of Daple positivity (box). TS > 3 was judged as positive. (d) Kaplan–Meier survival curves of patients with gastric cancer segregated by Daple expression status. (e,f) Representative images for Daple, Wnt5a/b and laminin γ2 expression in diffuse‐scattered (e) or diffuse‐adherent (f) types of gastric cancer. Scale bars, 100 μm.