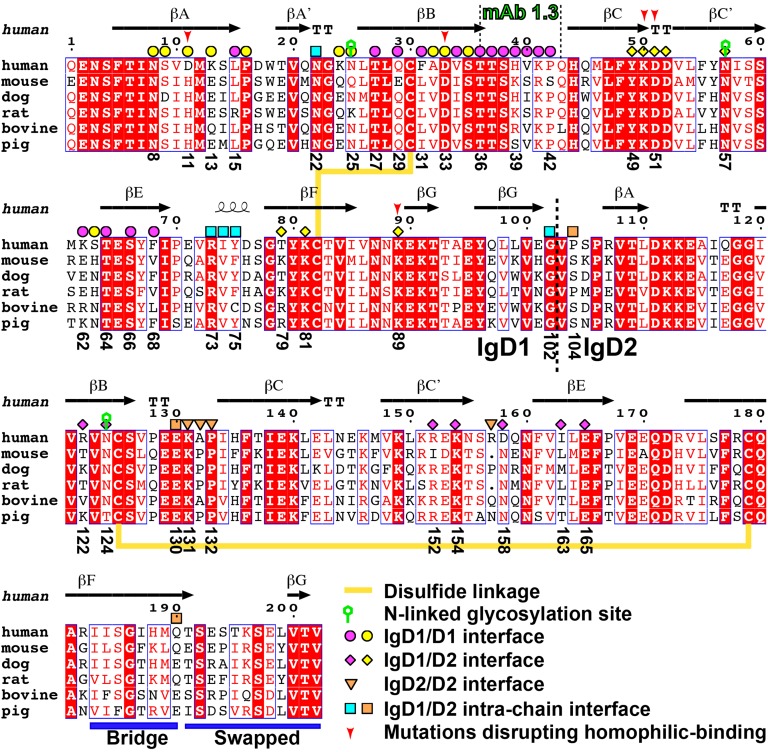
Figure 2.
Sequence alignment of PECAM-1 IgD1-D2 across species. The alignment was generated with the ESPript server48 and modified manually. Conserved residues are boxed and highlighted in red. Secondary structures were defined by the DSSP program49,50 based on the crystal structure of PECAM-1. Disulfide linkages, N-linked glycosylation sites, the epitope for mAb PECAM-1.3, and the IgD1-D2 boundary are indicated. The interfacial residues are marked with different shapes, with color codes corresponding to Figures 4 and 5. The F-G bridge region and the swapped G strand are indicated with blue bars.

