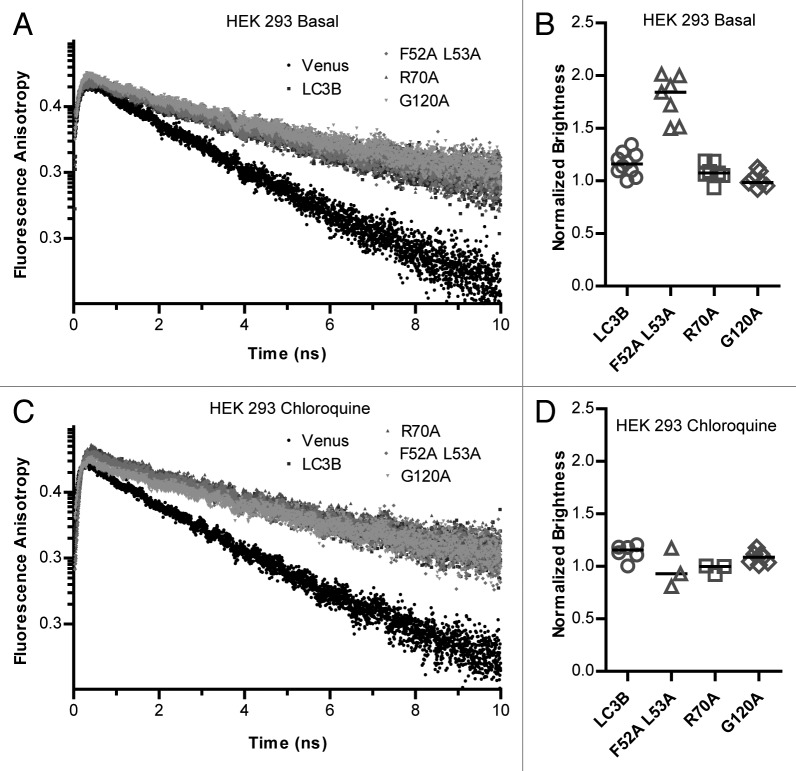
Figure 5. The majority of complexes contain one soluble Venus-LC3B, and mutations to LC3B’s hydrophobic surface at residues F52 and L53 but not R70 alter the stoichiometry of LC3B in complexes. TRFA analysis was performed using the microtime FPFA measurements collected from cytoplasmic extracts of HEK 293 cells individually expressing Venus, Venus-LC3B, Venus-LC3BF52A/L53A, Venus-LC3BR70A, or Venus-LC3BG120A under (A) basal conditions, or (C) after incubation in 100 μM chloroquine for 2 h. The decays are single exponential (linear on a semilog plot) indicating no detectable homo-FRET in all cases. Brightness analysis was performed using the macrotime from the FPFA measurements under (B) basal conditions or (D) after incubation in 100 μM chloroquine for 2 h. Anisotropy correlation times from replicate measurements can be found in Table 3. Brightness data are normalized to the average brightness of Venus. Bars represent the median. One-way ANOVA test P < 1 × 10⁻⁴ for the brightness measurements from either condition. Pairwise comparisons between all of the constructs under either condition were made using Bonferonni-corrected t tests as described in the text.

An official website of the United States government
Here's how you know
Official websites use .gov
A
.gov website belongs to an official
government organization in the United States.
Secure .gov websites use HTTPS
A lock (
) or https:// means you've safely
connected to the .gov website. Share sensitive
information only on official, secure websites.
