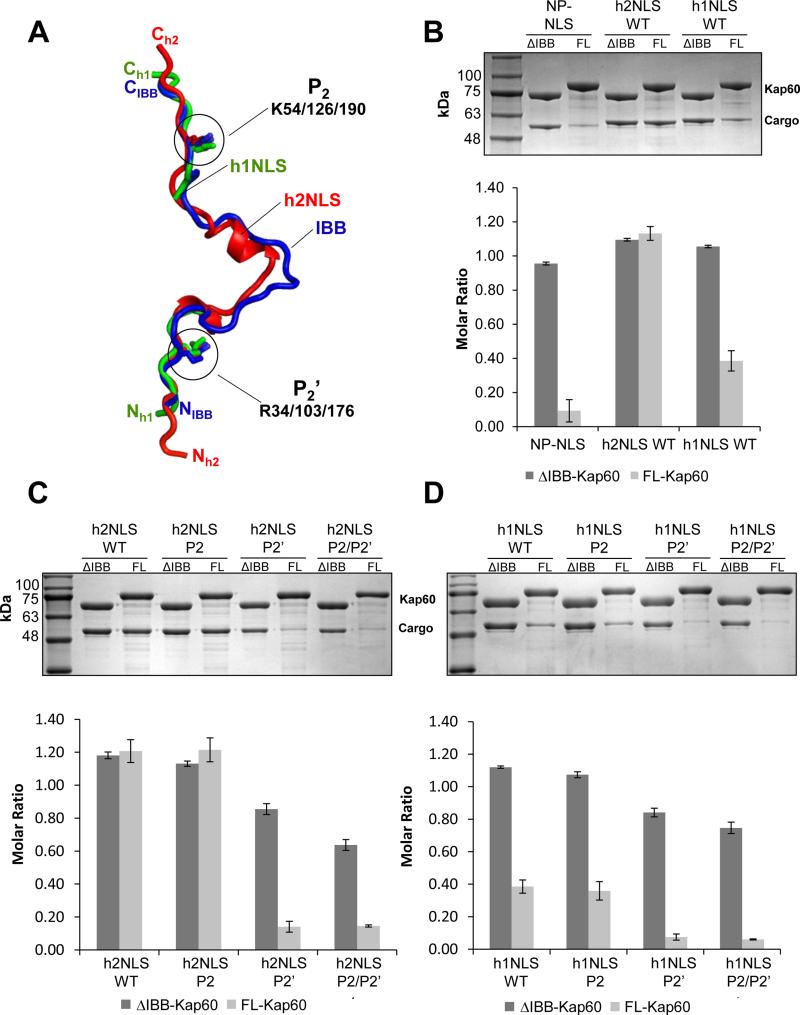
FIGURE 4. h2NLS and h1NLS compete off the IBB-domain of Kap60.
(A) Superimposition of ΔIBB-Kap60 bound to h2NLS or h1NLS with FL-Kap60 (pdb id 1WA5) (Matsuura and Stewart, 2004). h1NLS and h2NLS are colored in green and red, respectively, while the IBB-domain is blue. For clarity, Kap60 has been omitted. Only the Arg at P2’ and Lys at P2 are modelled as sticks. (B) Pull-down analysis and quantification of the interaction of GST-tagged Kap60 lacking the IBB (ΔIBB-) or full length (FL-) immobilized on glutathione beads and incubated with NP-NLS, h2NLS and h1NLS. (C) Pull-down analysis and quantification of the interaction of GST-ΔIBBKap60 or FL-Kap60 with WT h2NLS and mutants at P2’, P2 and P2/P2’(D) Pull-down analysis and quantification of the interaction of GST-ΔIBB-Kap60 or FL-Kap60 with wt-h1NLS and mutants at P2’, P2 and P2/P2’. Pull-downs are shown as mean ± standard deviation for three experiments. See also Figure S3.

