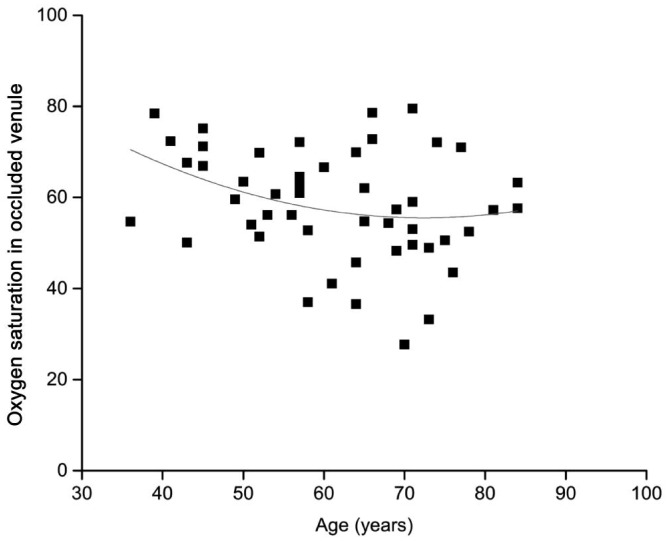
Figure 6. The scatter plots and fitted curves for SaO2-V to age in BRVO group.
The age was plotted on the X-axis, and the oximetry data (SaO2-V) are plotted on the Y-axis. The fitted curve for SaO2-V to age was shown in red (R2=0.06, y= -1.64x2+0.01x+37.47), indicating a negative correlation between SaO2-V and age.

