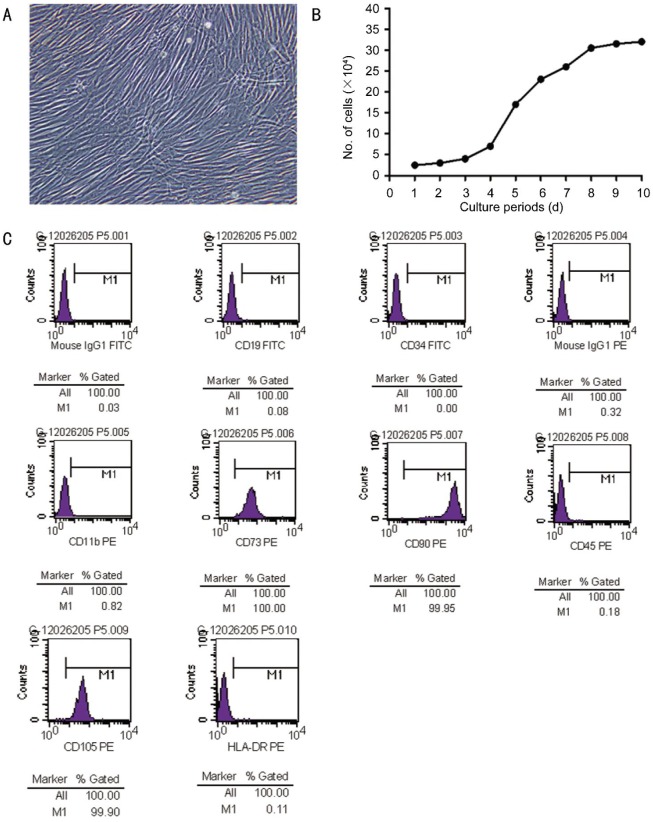
Figure 1. Morphologic, proliferative and immunophenotypic characterization of human UC-MSC.
A: Morphology at a 40×magnification; B: Growth curve measured by a trypan blue exclusion assay; C: Immunophenotype of MSC population that was derived from human umbilical cord. An open profile represents an isotype control for background fluorescence and a shaded one shows a positive signal.

