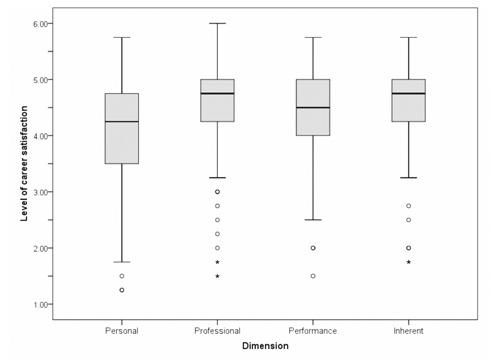
Figure 1.

Box plots depict, by the four dimensions, different distributions of measured levels of career satisfaction. The personal satisfaction presents a higher variation than the professional, performance, and inherent dimensions. The median of the personal dimension appears to be lower than the other three. The circles and asterisks represent outliers and extreme outliers, respectively.
