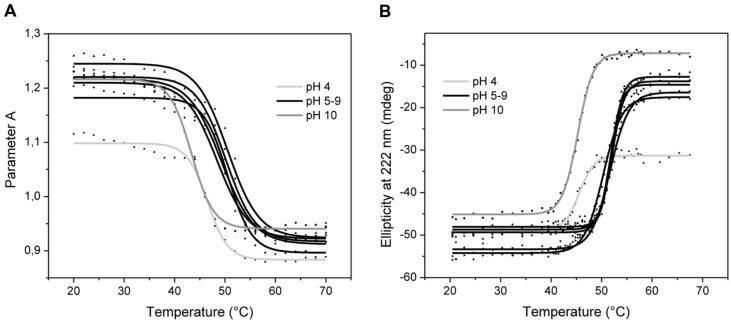
FIGURE 2.
Variation of ABgp46 tertiary and secondary structure with pH and temperature. (A) Correlation between fluorescence spectra and conformational changes deduced by plotting Parameter A as a function of the same pH and temperature ranges, for tertiary structure analysis. (B) Far-UV Circular dichroism thermal denaturation profiles (from 20 to 70°C, with heating rates of 2°C/min), measured at 222 nm, and at different pH values (pH 4.0–10.0) for secondary structure analysis.

