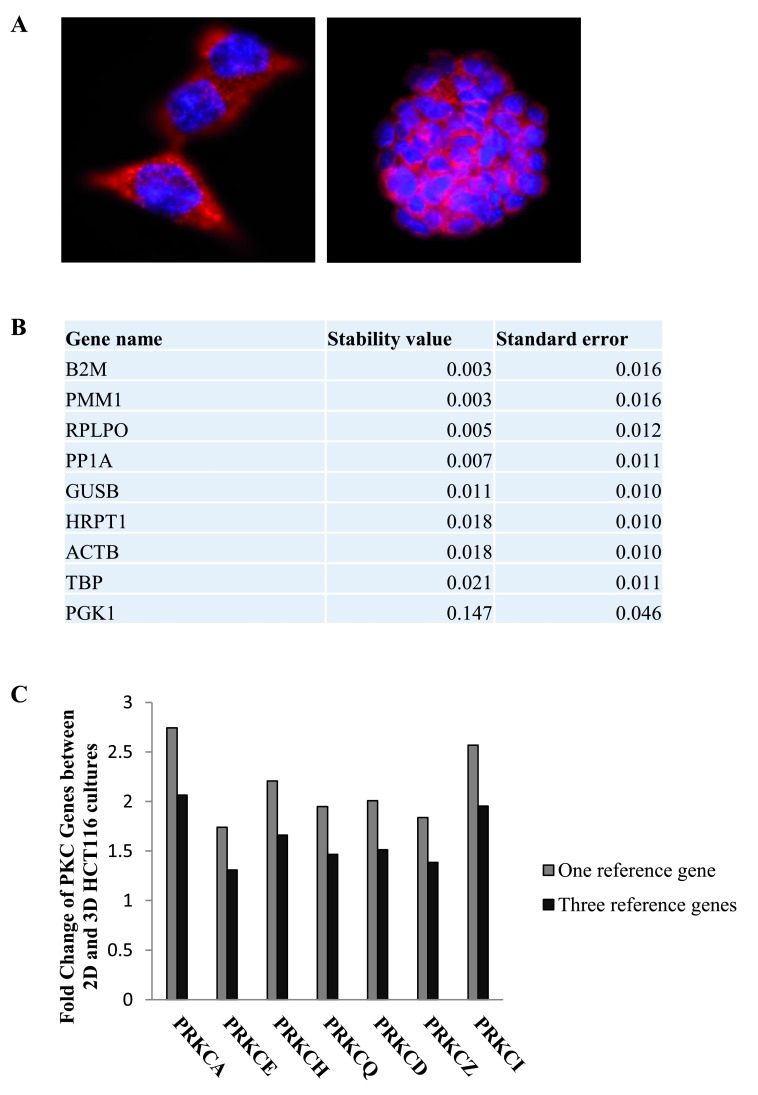
Figure 1. Reference genes in 2-dimensional and 3-dimensional HCT116 cultures.
The stability of the nine candidate reference genes between 2D and 3D HCT116 cultures was analysed using NormFinder. ( A) Immunofluorescence images of HCT116 cells in 2D (100X) (left panel) and 3D (right panel) cell cultures (63X). ( B) Table displaying the stability levels of the nine candidate reference genes between the 2D and 3D cultures. ( C) Graph representing the fold change of PKC coding genes in 3D cultures compared to 2D cultures when using one reference gene (B2M) versus three reference genes (B2M, PMM1 and RPLPO).

