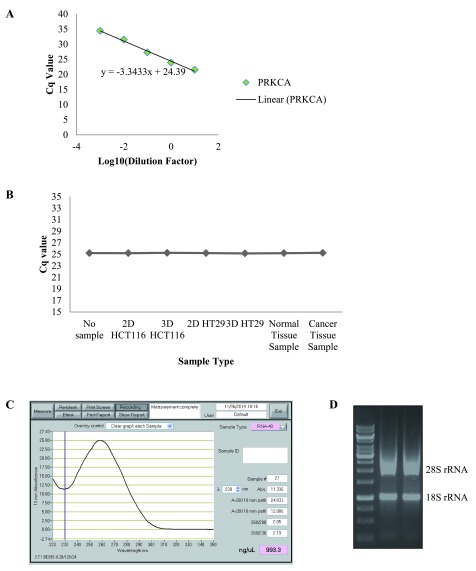
Figure 4. Considerations to comply with during RT-qPCR.
( A) Representative graph of assay efficiency check. ( B) Graph representing the inhibition test for all biological samples. ( C) Representative graph from Nanodrop Spectrophotometer displaying the quantity and purity of the RNA. ( D) Representative image of agarose gel displaying the 28S:18S ribosomal RNA ratio for RNA samples.

