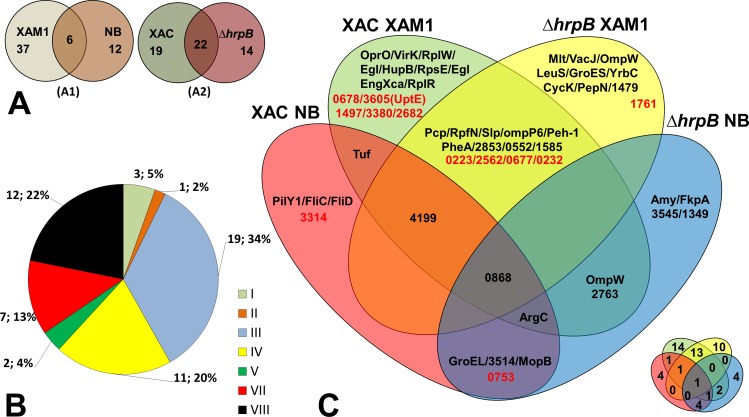
Figure 2. Comparative analysis of Xac secretome.
(A) Comparison highlighting 55 total detected proteins, correlating culture mediums (XAM1 × NB—A1) and strains (Xac and Δ hrpB4—A2) analysed. The two circles represent the total proteins detected. (B) Categorization of annotated protein functions, adapted from Da Silva et al. (2002): I, Intermediary metabolism; II, Biosynthesis of small molecules; III, Metabolism of macromolecules; IV, Cell structure; V, Cellular processes; VI, Mobile genetic elements, VII, Pathogenicity; virulence, and adaptation, VIII, Hypothetical/Conserved hypothetical genes; XI, Without a defined function. (C) Venn Diagram highlighting each of the proteins detected under the four different conditions tested. Proteins annotated as hypothetical are highlighted in red. The same Venn diagram is shown on a smaller scale but with only the numbers of the proteins detected in each condition.

