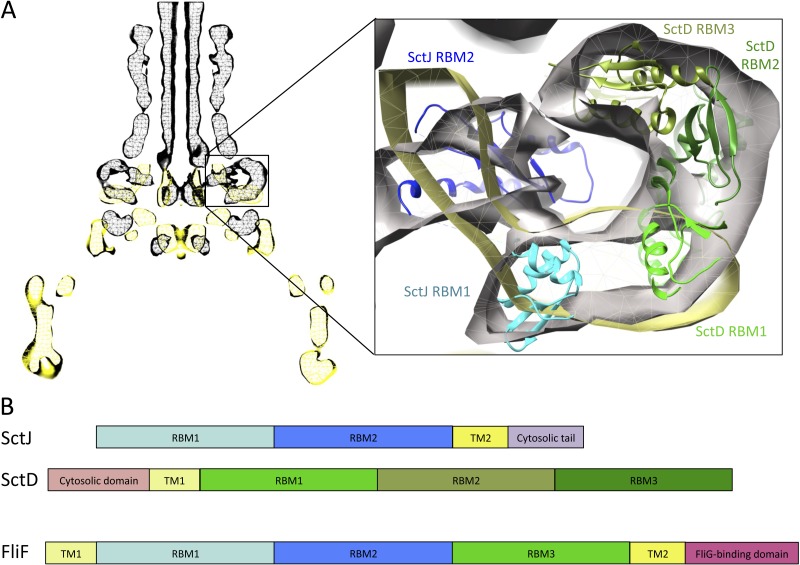
Figure 6. Comparison of the flagellar and T3SS basal body.
(A) EM maps of the S. typhimurium T3SS basal body (EMBD ID: 1875) in black, overlaid on that of the S. typhimurium flagellum basal body (EMBD ID: 1887) in yellow. A close-up view of the S-ring region of the flagellum is shown on the left, with the SctJ/SctD ring model (PDB ID 3J6D) docked in the T3SS EM map. The SctJ RBM1 is in cyan and the RBM2 in blue, and the three SctD RBMs are in green. (B) Schematic representation of SctJ, SctD and FliF, with the TMs in yellow, and the RBMs colored as in (A) for SctJ and SctD. Corresponding domains are indicated in FliF.

