
Fig. 3.
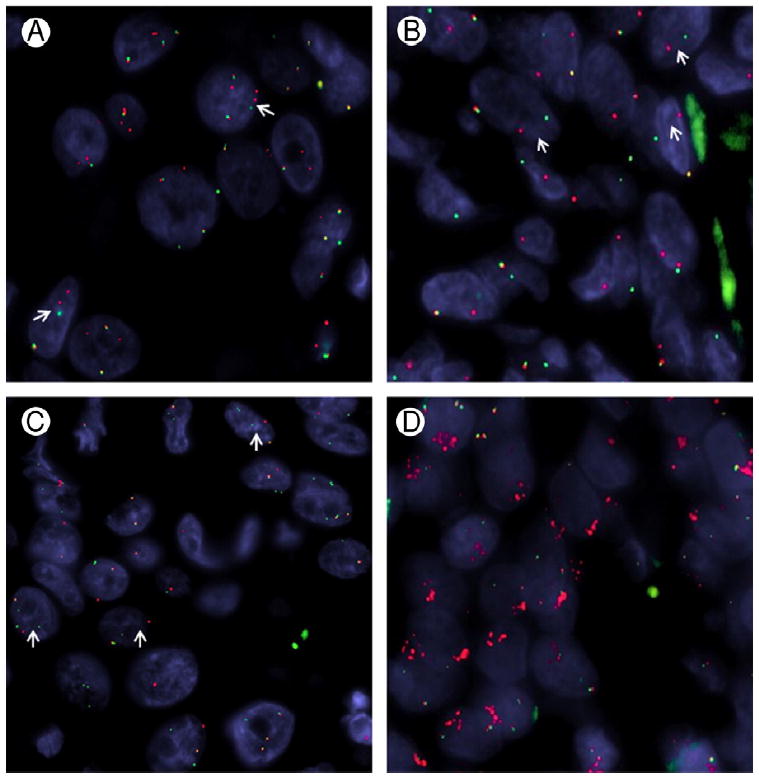
PLAG1, HMGA2, CTNNB1, and FGFR1 gene abnormalities by FISH. A, PLAG1 gene rearrangement (arrows) in an SDC CA ex-PA (CA ex-PA #12). B, HMGA2 break-apart (arrows) in a typical PA with hypocellular matrix (PA #5). C, SDC-type CA ex-PA showing a CTNNB1 gene rearrangement (arrows; CA ex-PA #12). D, Unbalanced FGFR1 rearrangement pattern associated with telomeric deletion (green signal) and subsequent centromeric amplification (red signal), MECA ex-PA (CA ex-PA #2).