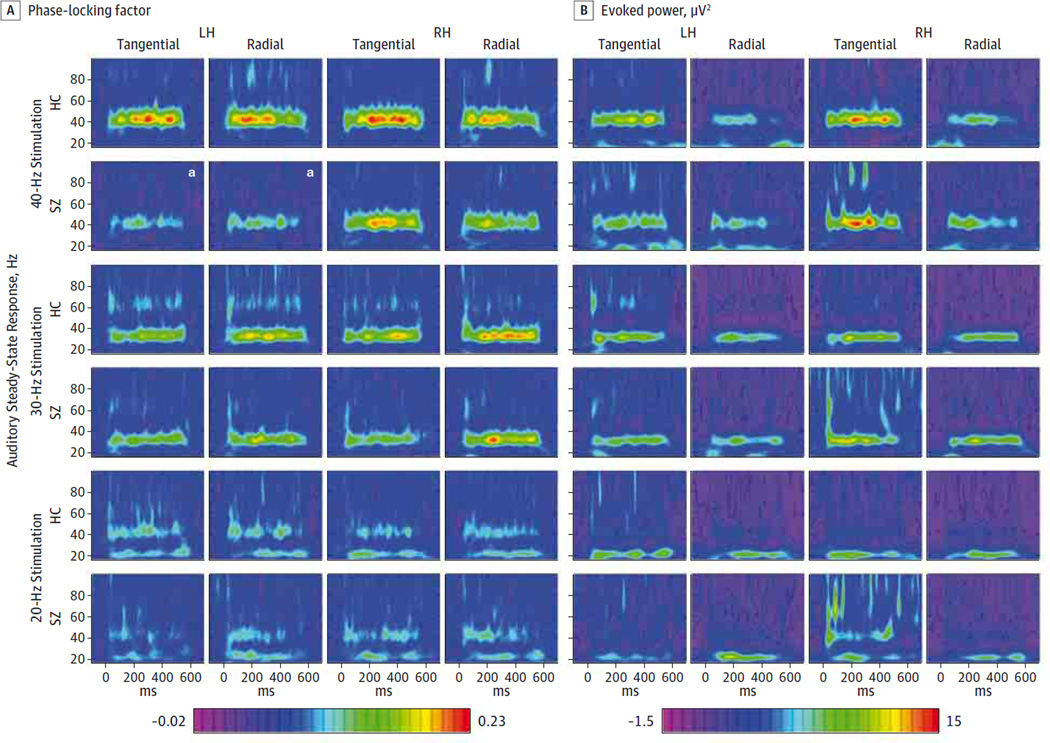
Figure 2. Time Frequency Maps of Evoked Gamma Oscillations in the Auditory Cortex.
Time frequency maps of cortical dipole source activities for the 20-, 30-, and 40-Hz auditory steady-state response (ASSR) for healthy control participants (HC) and patients with schizophrenia (SZ). A, Color scale indicates phase-locking factor (PLF) values. B, Color scale indicates power values inmicrovolts squared. RH indicates right hemisphere.
a Left hemisphere (LH) tangential and radial ASSR PLF during the 40-Hz stimulation were significantly reduced in patients with SZ.

