Abstract
A fatty liver is known to have impairment of microcirculation, which is worsened after ischemia reperfusion injury (IRI). This makes most fatty grafts unsuitable for transplantation, and in the absence of real time assessment of microcirculation this selection has been at best, random. The goal of this study was to demonstrate the utility of a contrast enhanced ultrasound model in quantitative assessment of the microcirculation of a fatty liver. We subjected fatty mice to IRI and blood flow dynamics were assessed before and after the injury. There was a significant increase in the resistive and pulsatility index of the extra hepatic artery and a significant decrease in velocity of the portal vein. There was also a quantifiable decrease in the intrahepatic blood volume, blood flow, time to peak flow, and perfusion index of mice with fatty liver suggesting that a fatty liver develops hemodynamic abnormalities after IRI, leading to increased hepatocellular injury. Importantly, these abnormalities can be reliably quantified by using a contrast, enhanced Doppler ultrasound, an inexpensive technique with multiple clinical applications. It can be used to assess the quality of the fatty liver donor graft prior to organ retrieval; for determining live donor candidacy, for making post IRI recovery prognosis, and for assessing the effectiveness of therapeutic interventions.
Keywords: Fatty liver, sinusoidal space, ischemia reperfusion injury, doppler ultrasound, resistive index, pulsatility index, perfusion index, non-targeted contrast micro bubbles
Introduction
Compared to a control, ‘non-fatty’ liver (referred to hereafter as normal liver), the fatty liver is significantly more susceptible to ischemia reperfusion injury (IRI). (1) (2) The critical barrier to progress in treating the fatty liver is our incomplete understanding of the mechanism underlying the susceptibility of the fatty liver to injury. Identification of factors contributing to hepatocellular damage will help in developing therapeutic targets to mitigate this injury.
Our laboratory explored mechanisms, which make a steatotic liver more vulnerable to cell death after IRI. Our earlier studies have demonstrated increased necrosis, apoptosis, (3) and autophagy in the fatty liver after IRI. (4) However, the underlying mechanism that predisposes the fatty liver to post –IRI cell death remains unknown. It is hypothesized that impairment of hepatic microcirculation is one of the key events in the development of hepatocellular dysfunction in steatosis. (5) (6) (7) It has also been shown that microcirculatory changes affect the outcome of the fatty liver graft, (if transplanted) leading to denial of several potentially useful organs. Obese living donor candidates are also routinely turned down for liver transplantation because clinicians assume they have baseline severe microcirculatory changes, which could not withstand IRI insults during transplantation. However there is a dearth of reliable, clinically useful tools to assess this microcirculation in the real time clinical setting. Thus, a quantitative hemodynamic investigation of fatty livers before and after IRI could have important mechanistic, diagnostic and therapeutic implications.
In the present study, we assess the microcirculatory changes in the fatty liver and demonstrate the magnitude of change in microcirculation following IRI. We have used an established mouse model of hepatic steatosis by feeding C57BL/6 mice, a 60% high fat diet (HFD) for 12 weeks and subjecting them to IRI. (3) (8) The Doppler parameters used to assess hepatic artery and portal vein abnormalities have been utilized along with real time imaging using contrast enhanced ultrasound. These techniques have wide clinical applicability and are a novel way to aid in the selection of fatty grafts or live organ donors for the ability to withstand IRI during transplantation.
Materials and Methods
Experimental animals
The Institutional Animal Care and Use Committee (IACUC) of Emory University approved all procedures performed on animals. Mice were maintained on a 12-hour dark-light cycle and allowed free access to food and water under conditions of controlled temperature (25 ± 2°C).
High fat diet fed mice
A total of 64, C57BL/6 male mice were obtained from Jackson Research Laboratories (Bar Harbor, ME) at 4 weeks of age. These mice were divided into 2 groups. Group 1 was given regular mouse chow, while Group 2 was fed a high fat diet (60% fat; Research Diets Inc, NJ) ad libitum for 12 weeks before subjecting them to IRI.
Hepatic ischemia reperfusion injury (IRI)
Steatosis was confirmed in HFD fed mice by Oil Red O stain. (3) Group 1 was divided into lean mice with normal liver (lean control, n=16) and lean mice with normal liver undergoing IRI (n=16). Similarly group 2 was divided into mice with fatty liver (HFD control, n=16), and mice with fatty liver undergoing IRI (HFD IRI, n=16). Prior to IRI, mice from normal and fatty liver groups were subjected to ultrasound imaging to record the baseline blood flow measurements under continuous isofluorane (1.5–2%) anesthesia. After the baseline blood flow measurements, the animals were anesthetized using pentobarbital (50mg/kg) and then subjected to IRI as described in our previous publication.(3) Briefly, a vertical incision was made through the skin and peritoneum, exposing the porta hepatis. Blood flow to the liver was blocked by placing a small clamp on the portal vein and the hepatic artery. Ischemia was induced for 20 minutes and demonstrated by the pale color of the liver. After 20 minutes the clamp was removed to allow reperfusion. The abdomen was closed and animals were placed in a recovery cage. Liver sections were processed for histology after 24 hours of reperfusion.
Histological evaluation
Paraffin sections of liver tissues of normal and fatty liver mice (n=6 each) were stained with Hematoxylin and Eosin (H & E). Six random images with 100X magnification were taken and the average area of the sinusoid and the hepatocyte was calculated using 10 sinusoids and hepatocytes per high power field. This was done using the Fiji image J software.
Hepatic artery and portal vein blood flow analysis by ultrasound Doppler imaging
Ultrasound measurements were done before IRI and 24 hours after reperfusion in both lean and HFD fed mice to study the effects of IRI on microcirculation. The animals were maintained on a 1.5–2% isofluorane anesthesia and positioned on the platform in the supine position. Respiratory physiology, electrocardiogram and body temperature was monitored during the procedure. Hepatic artery and portal vein blood flow hemodynamics were analyzed using a Vevo 2100 high frequency, digital, linear array, color Doppler, small animal ultrasound machine using the B-mode, pulsed wave and color Doppler mode. The movement of blood cells was reflected in a change in the pitch of the reflected sound waves (called the Doppler effect). The signals generated were displayed in graphs or color pictures. Color Doppler mode allowed for rapid identification of arteries and veins with ease and enabled accurate sampling and quantification of the blood flow. Peak systolic value (PSV), low diastolic value (LDV) and mean velocity (MV) were used to calculate the RI and PI. The following formulae were used: RI= PSV-LDV/PSV; Pulsatility Index (PI)= PI= PSV – LDV/MV. Velocity time integral (VTI) is a measure of the blood flow velocity within the vessels and was measured in the hepatic artery. Maximum velocity of the portal vein was also measured. The Doppler gate length was 5 mm and angle between the Doppler ultrasound beam and the long axis of the hepatic artery was maintained between 300 and 600. The spectral waveform of hepatic artery was recorded for at least 5 seconds using a MS 550D transducer for abdominal imaging.
Contrast enhanced ultrasound imaging
An ultrasound contrast agent consisting of gas-filled micro bubbles (mixture of nitrogen and perfluorobutane) was used to enhance the acoustic signal of blood in the circulation. (9–11) Additionally, it allowed visualization and quantification of regional microvasculature of the liver. The contrast agent was reconstituted in 0.7 ml of sterile saline, agitated by hand and allowed to equilibrate for 10 minutes. Then it was injected into the mouse as a 50μl bolus through the retro orbital vein. Micro-bubbles are confined to the vascular compartment of the liver and provide strong reflections of the sound waves thereby providing detailed imaging of the hepatic blood circulation. Maximum intensity profile (MIP) video clips were obtained for real time assessment and quantification of blood flow. This noninvasive approach to image organs in real time, without disrupting tissue dynamics and physiological processes, can be done at multiple time points. Total blood volume, time to peak blood flow, and the perfusion index were all calculated to create a complete profile of hepatic blood flow. (12)
Statistical analysis
Statistical analysis was performed by Student’s t test (Prism 4.0; Graph PAD, San Diego, CA, USA). A probability value of p < 0.05 was regarded as significant.
Results
Fatty liver mice undergoing IRI had a significant constriction of the sinusoidal area
High fat diet fed C57BL/6 mice developed a fatty liver at the end of 12 weeks as described in the Methods section. These mice demonstrated a significant increase in body weight (HFD: 49.4 ± 0.6; lean: 28.9 ± 0.8 grams, p<0.001) and a significant accumulation of fat as has been demonstrated in our previous publication. (3) As shown in Figure 1A, the sinusoidal area from lean mice demonstrated wide spaces between hepatocytes, with a total area of 25944 ± 3176 pixel2 (Figure 1A). In contrast, fatty liver of HFD fed mice showed a significant reduction in the sinusoidal area to 6745 ± 1021 pixel2 (p<0.0001, Figure 1B). Imposing IRI on HFD mice further reduced the sinusoidal area to 4191 ± 436, (p<0.03, Figure 1D). In contrast, the sinusoidal area of lean mice subjected to IRI was not significantly reduced (21308 ± 2733, p<0.3; Figure 1C). These findings are graphically summarized results in Figure 1E. The decrease in sinusoidal space in HFD fed mice is likely due to significant increase in hepatocyte area due to increased lipid in the cytosol (74030 ± 6786 pixel2) compared to the hepatocytes in the lean mice (45216 ± 5288 pixel2, p<0.05, Figure 1F). Imposing IRI did not induce any further significant increase in the hepatocyte area either in HFD fed mice or in lean mice (Figure 1F).
Figure 1. Fatty liver mice undergoing IRI had a significant constriction of the sinusoidal area.
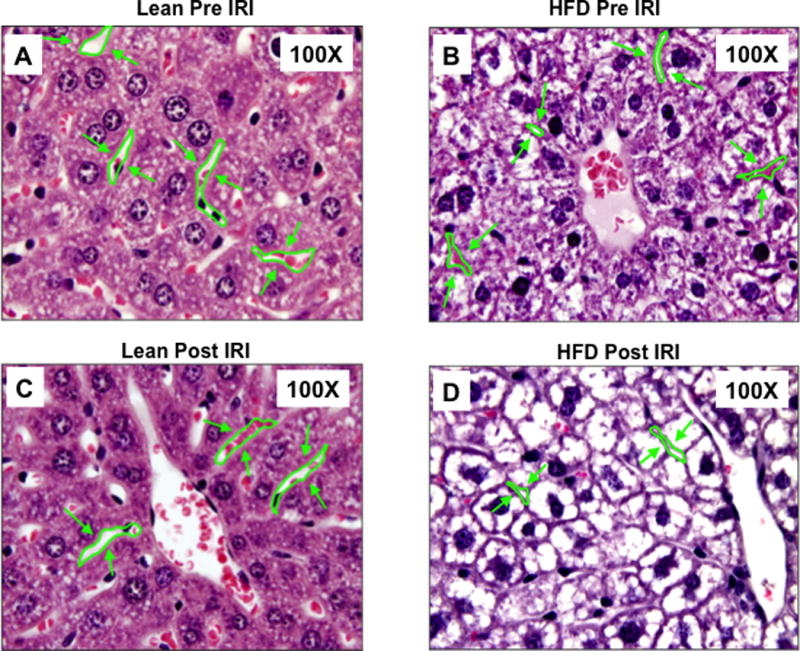
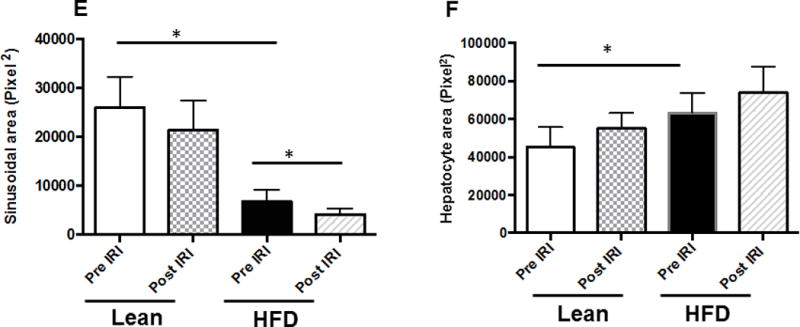
Light microscopic images of H & E showing sinusoidal area in liver (magnification, 100×) (A–D). Representative image of liver sections from lean Pre IRI (A); HFD pre IRI (B); lean post IRI (C); HFD post IRI (D). Arrows show sinusoidal spaces. (E) Graphical representation of average sinusoidal area (per high power field). Lean mice pre IRI and HFD fed mice pre IRI (p<0.0001); HFD fed mice pre IRI vs HFD fed mice post IRI p<0.03. (F) Area of hepatocytes from lean and HFD mice pre IRI (p<0.05) and post IRI (NS).
Portal vein blood flow velocity (Vmax) was significantly lower in HFD fed mice post IRI
Increased intrahepatic resistance is routinely assessed by alterations in the in-flow to the liver i.e. in the hepatic artery and portal vein. At baseline, it was observed that the Vmax of the portal vein of HFD fed mice was significantly lower compared to that of lean mice (69.7 ± 3.7 vs. 82.4 ± 2.4 mm/sec, p<0.01). After IRI, Vmax for the HFD fed mice was significantly lower compared to pre IRI values (post 34.7 ± 3.0 vs. pre 69.7 ± 3.7, p<0.0001; Figure 2C, D, E). This difference in Vmax was not seen in lean mice, pre and post IRI (post IRI 82.4 ± 2.4 vs. pre IRI 78.5 ± 2.3mm/sec, p<0.26; NS; Figure 2A, B, E). Pulsatility index was significantly increased after IRI (HFD post IRI 0.49 ± 0.04 vs. pre IRI 0.16 ± 0.01; p< 0.0001), whereas there was no increase in lean mice before and after IRI (post IRI 0.26 ± 0.008 vs. pre IRI 0.26 ± 0.02, p<0.91; Figure 2F).
Figure 2. Portal vein blood flow velocity (Vmax) was significantly lower in HFD fed mice post IRI.
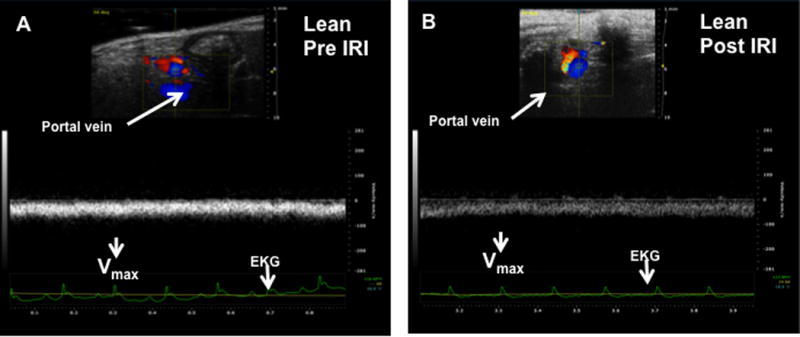
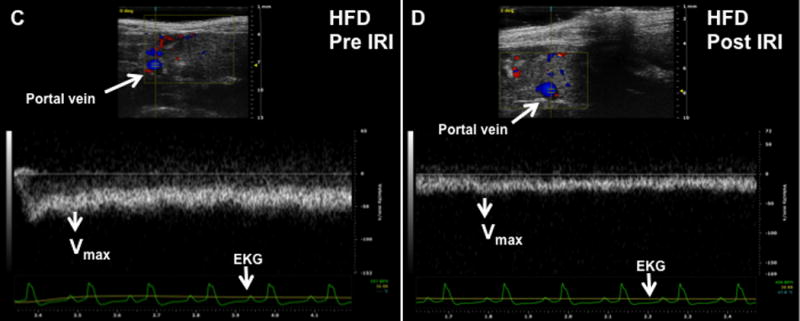
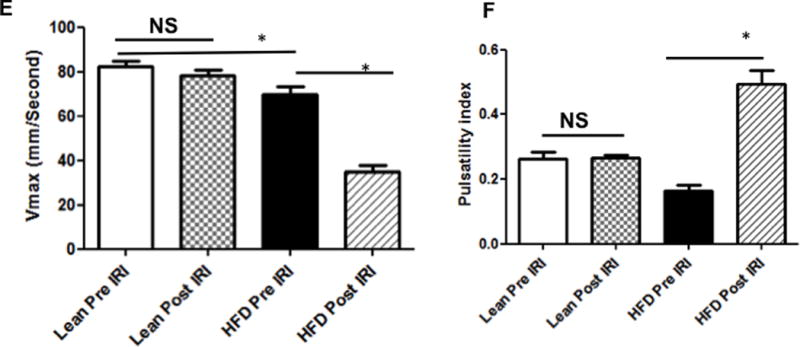
Representative ultrasound Doppler image of the wave pattern of the portal vein (A): lean pre IRI; (B): lean post IRI; (C): HFD pre IRI and (D): HFD post IRI. Graphical representation of Vmax of the portal vein is presented in Figure 2E. Open bar represents lean pre IRI, black bar represents HFD pre IRI, gray hatched bar represents lean post IRI and striped bar represents HFD post IRI. Lean pre IRI vs HFD pre IRI, p<0.01, HFD pre IRI vs HFD post IRI, p<0.0001. Graphical representation of Pulsatility index is presented in Figure 2F: PI of lean pre IRI vs HFD pre IRI, p<0.006. PI of HFD pre IRI vs HFD post IRI, p<0.007. Data are mean ± SD, n=8. EKG (Electrocardiogram) trace at the bottom of these panels shows heartbeat.
Resistive index and pulsatile index were significantly higher in the hepatic artery of fatty liver of HFD fed mice undergoing IRI
After assessing portal vein hemodynamics we now calculated the RI and PI in the hepatic artery by formulae explained in the Methods section. At baseline, RI was significantly higher in fatty liver of HFD fed mice compared to lean mice (0.58 ± 0.02 vs. 0.46 ± 0.04, p<0.03). After IRI, the fatty liver demonstrated a significantly higher RI compared to the normal liver (0.74 ± 0.01 vs. 0.52 ± 0.04, p< 0.002, Figure 3F). Similarly, fatty liver of HFD fed mice undergoing IRI also showed significantly higher PI in the hepatic artery compared to lean mice (1.35± 0.09 vs. 0.77 ± 0.12, p<0.03, Figure 3G). Though the differences in RI and PI between a fatty liver and a normal liver were significant, they were further accentuated after IRI in the fatty liver but not in the normal liver (Fatty liver, before and after IRI: RI: 0.58 ± 0.02 vs. 0.74 ± 0.01; p< 0.0002; PI: 0.75 ± 0.04 vs. 1.35± 0.09; p<0.0002; normal liver before and after IRI: RI: 0.46 ± 0.03 vs. 0.52 ± 0.04; p<0.31; PI: 0.60 ± 0.07 vs. 0.77 ± 0.12; p>0.28). Further, the impact of a low systolic peak in the fatty liver lead to a significant reduction in the blood flow velocity (signified by velocity time integral (VTI) within the fatty liver before IRI (26.09 ± 1.9 vs. 17.95 ± 2.2 mm p<0.02) and after IRI (Lean: 21.26 ± 2.0 vs. HFD: 13.33 ± 0.87 mm, p<0.02). These results clearly demonstrate that there are perturbations and impairment of blood flow in the portal vein and hepatic artery of the fatty liver before IRI, which are further exacerbated after IRI.
Figure 3. Resistive index and pulsatile index were significantly higher in the hepatic artery of fatty liver of HFD fed mice undergoing IRI.
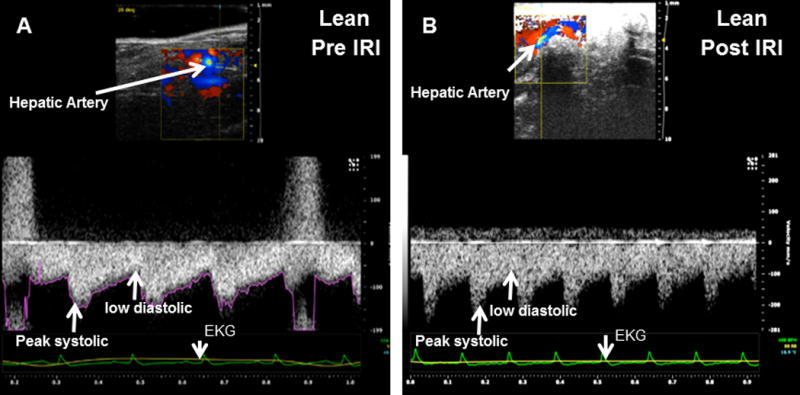
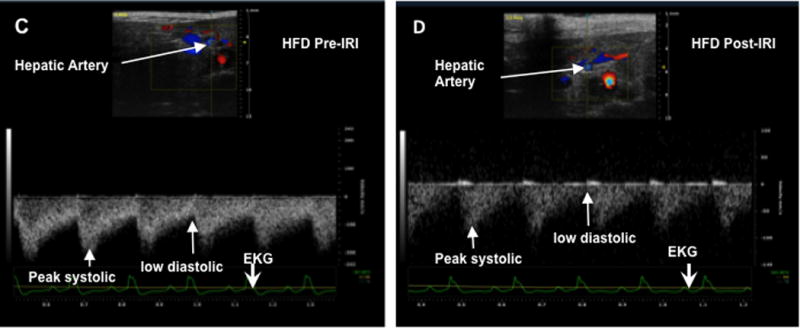
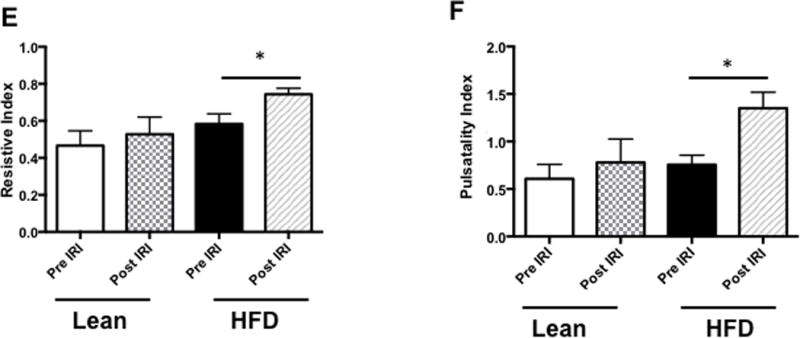
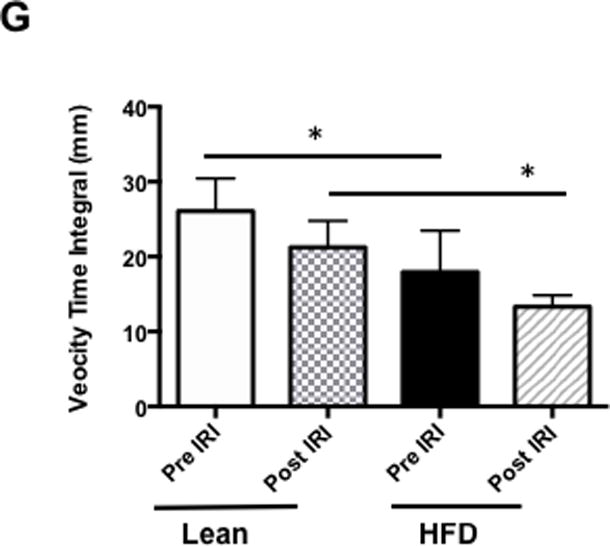
Representative ultrasound Doppler image of the wave pattern of hepatic artery in (A) lean pre IRI, (B) lean post IRI, (C) HFD pre IRI, and (D) HFD post IRI. Resistive index is presented in Figure 3E. RI of lean pre IRI vs lean post IRI, p<0.04; and RI of HFD pre IRI vs HFD post IRI, p<0.04. Graphical representation of Pulsatility Index is presented in Figure 3F. Pulsatility Index of lean pre IRI vs lean post IRI, p<0.007; PI of HFD pre IRI vs HFD post IRI, p<0.007. Figure 3G depicts graphical representation of velocity time integral between lean and HFD pre and post IRI, p<0.02. Data are mean ± SD, n=8.
Bolus perfusion of micro bubbles demonstrated a significant alteration and reduction in the intrahepatic microcirculation of fatty liver after IRI
We injected non-targeted contrast micro bubbles into lean and HFD fed mice with continuous monitoring under the contrast mode of the ultrasound as described in Methods. Maximum intensity profile (MIP) video clips for real time examination are shown in Figure 4A (normal liver) and 4B (fatty liver). The results of these studies demonstrate that there was a significant increase in time taken for the contrast to reach peak in a fatty liver as compared to a normal liver post IRI (HFD: 10.84±1.78 vs. 3.7±0.48 seconds, p<0.003, Figure 4 C & D). These results are shown as Maximum intensity profile (MIP) video clips providing a real time assessment of intrahepatic blood flow (Figure A, B) along with quantification (Figure 4E). In addition, total blood volume (of the liver), blood flow through the liver and perfusion index of the liver were significantly reduced in the fatty liver compared to a normal liver, post IRI (blood volume: HFD: 19.0±4.3 vs. lean: 103.2±32.0 p<0.01; Blood flow: HFD: 4.7±1.4 vs. lean: 77.7±35.4 p<0.02 and perfusion index: HFD: 11.4±2.7 vs. lean: 54.2±20.07 p<0.02) Figure 4G. Time to reach peak blood flow was significantly worse after IRI in the fatty liver as compared to before IRI (14.5 ± 0.9 vs. 9.8 ± 1.8 p<0.03).
Figure 4. Bolus perfusion of micro bubbles demonstrated a significant alteration and reduction in the intrahepatic microcirculation of fatty liver after IRI.
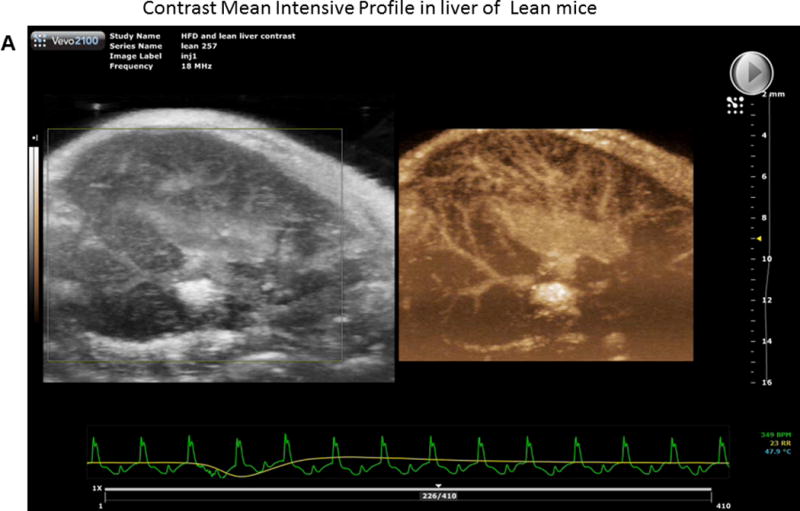
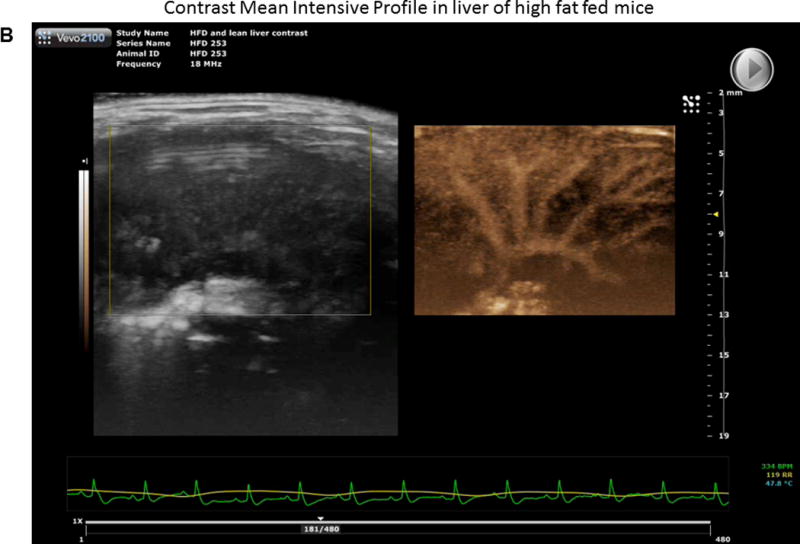
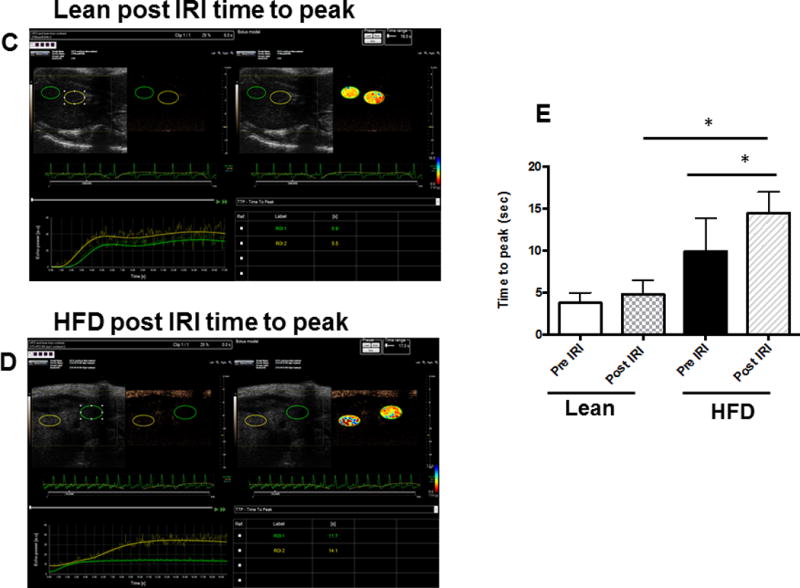
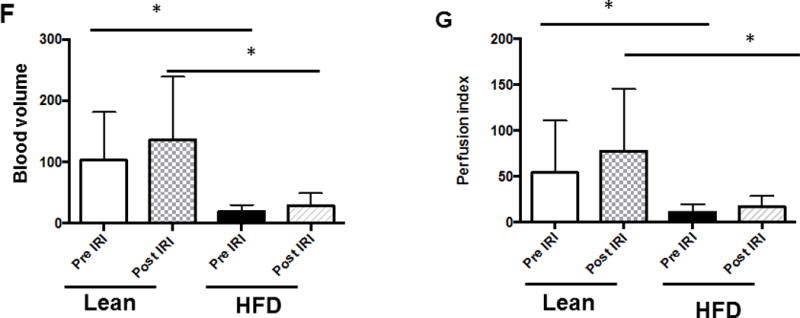
(A & B) representative contrast imaging video clips of Mean Intensive Profile (MIP) from lean mice and HFD fed mice respectively. The images represent micro bubble entry and perfusion into the liver sinusoids. In addition, the video clip is also included. (C) Representative ultrasound images of contrast ‘time to peak’ images of lean mice post IRI; each circle represents the region of interest (ROI) and was randomly picked to assess perfusion. (D) Fatty liver of HFD fed mice post IRI. (E) Graphical representation of ‘time to peak’: p<0.0001, (F) Total blood volume: Lean pre IRI vs HFD pre IRI p<0.01, lean post IRI vs HFD post IRI p<0.01 and (G) perfusion index: Lean pre IRI vs HFD pre IRI p<0.04, lean post IRI vs HFD post IRI p<0.04. Data are mean ± SD, n=8.
A decrease in blood volume, blood flow, and perfusion index with a concurrent increase in ‘time to peak’ intrahepatic blood flow, and RI, PI, VTI (hepatic artery) and decrease in Vmax (portal vein) of the fatty liver clearly indicate increased resistance to blood flow not only in the ‘in-flow’ to liver but also within the liver sinusoids. This is not only seen at baseline in the fatty liver as compared to the normal liver but is also considerably worsened after imposing IRI.
Discussion
It has been shown that steatotic livers are vulnerable to hepatic IRI. Our laboratory has been exploring the mechanisms underlying the increased susceptibility of a fatty liver to IRI induced cell death. Using established in vitro and in vivo models of steatosis; we have earlier demonstrated the susceptibility of a fatty liver to IRI with increased necrosis (5) and autophagy. (4) In the present study, we investigated changes in sinusoidal spaces and microcirculation in a steatotic liver following IRI. We show that, in a fatty liver, sinusoidal space was reduced by 60% compared to a normal liver. As a result of constricted sinusoidal spaces, a fatty liver demonstrated impaired hepatic microcirculation. Portal vein and hepatic artery blood flow parameters were significantly perturbed, which was evident from a significant increase in RI and PI in the hepatic artery and decreased Vmax in the portal vein, indicating high resistance within the liver. These observations are in agreement with literature findings of altered hepatic microcirculation in human donor fatty livers during organ retrieval. (13) In addition, experimental studies in animal models with fatty liver also showed that fat infiltration reduces hepatic blood flow and microcirculation; and that both hepatic blood flow and microcirculatory flow within the liver are affected by the extent of fat infiltration. (5) (14) (15) (16) Regulation of exchange of plasma and solutes takes place across the sinusoids, which are lined by a fenestrated endothelium that allows maximum contact between the hepatocytes and the hepatic inflow. (17) The hepatic microcirculatory changes and compromised cellular function occurring during injured conditions are not fully understood. According to previous reports, impairment of hepatic microcirculation is a key event in the development of cellular dysfunction in liver diseases such as hepatic steatosis (5), ischemia-reperfusion injury (18) and cirrhosis. (19)
In addition, IRI in its own right, also has the potential to contribute to the narrowing of sinusoidal space. Ischemia reperfusion injury starts with lack of oxygen, which in turn leads to a decrease in ATP in hepatocytes. As a result, the function of the ATP-dependent sodium/potassium plasma membrane pump is compromised. This results in an increase in intracellular Na+, followed by swelling of the hepatocytes with influx of water, and eventually narrowing of the sinusoidal spaces. Thus, a combination of steatosis, together with IRI, results in a significant narrowing of sinusoidal spaces. Interestingly, imposing IRI on lean mice did not cause any significant change in these parameters. These observations suggest that IRI induced perturbations in sinusoidal spaces and hepatic microcirculation are minimal in lean mice at least under the present experimental conditions, and require steatotic conditions to see accentuated effects. These considerations are in conformity with our earlier findings that imposing IRI on HFD fed mice resulted in increased liver injury as evidenced by increase in serum ALT levels, autophagy, and necrosis, while imposing IRI on lean mice did not increase liver injury. (3, 4)
Duplex Doppler sonography is a major diagnostic tool for the noninvasive assessment of the hemodynamics of hepatic vessels. Many reports indicate that hepatic vascular hemodynamics is altered in parenchymal liver diseases, especially in fatty liver disease. (6, 15) (7, 20)The novel aspect of our study is a real-time demonstration of the liver microvasculature. There is a dearth of reliable non-invasive tools for direct assessment of liver sinusoidal resistance and blood flow, and traditionally, RI and PI of the hepatic artery have been used as surrogate markers. In our study, we used non-targeted contrast micro bubbles to evaluate the intrahepatic flow patterns. We showed that not only was there a delay in reaching peak blood flow in the liver after reperfusion; it was also slower, with overall reduced blood volume in the fatty liver, even prior to IRI. This clearly has wide clinical implications. Intra-operative ultrasound is routinely used during liver transplantation and other liver surgeries, but only the flow in the extra-hepatic vessels is measured; which, at best, is an indirect marker of intra hepatic microcirculation. We demonstrate a novel technique, which can be easily and safely used to directly assess the liver microcirculation. This technique would be of great utility during liver transplantation and especially in quantifying liver microcirculation during the assessment of a liver graft. Additionally, live-donor liver microcirculation could also be quantified by this technique, thereby determining the eligibility for partial liver donation. As several other studies including ours clearly indicate, this method is an ideal noninvasive imaging tool, especially for use in longitudinal monitoring of disease activity. (21) Importantly, the fact that ultrasound does not expose the patients to radiation and is a commonly used bedside technique makes it very attractive for routine clinical use. It is important, however, that a user who is trained in the technique performs the ultrasounds. To prevent false readings, angle correction needs to be done and the transducer pressure should be kept constant, as was done in our study with a single experienced mouse sonographer. Additionally our sonographer was not blinded to the study groups and the authors acknowledge that this could potentially introduce a bias.
In summary, our study demonstrates that a fatty liver exhibits intra hepatic microcirculatory and extra hepatic blood flow abnormalities, which are further accentuated by IRI. We postulate that these blood flow abnormalities contribute to the increased hepatocellular damage, which is seen after IRI in a steatotic liver. Importantly, our study also indicates that the use of duplex Doppler sonography and non-targeted contrast micro bubbles provide a simple and relatively noninvasive approach for real-time study of the intrahepatic liver microcirculation. In addition to direct clinical application, it also provides a reliable and reproducible small animal model for development of therapeutic strategies to mitigate hepatocellular damage by improving microcirculation in steatotic livers.
Supplementary Material
What is known
Impaired Hepatic microcirculation in a fatty liver during IRI results in increased cell death in a steatotic liver. Ultrasound doppler of the hepatic artery and portal vein provide an indirect proxy for this assessment, however they are not reliable for clinical decision-making.
What is new
Intrahepatic microcirculation is further compromised after IRI in a fatty liver; this is likely a critical underlying mechanism for increased hepatocellular death.
Ultrasound measurements using contrast-enhanced micro bubbles provide a real time and quantitative assessment of the intrahepatic microcirculation.
This technique can be utilized for drug intervention studies, thereby providing therapeutic targets for improving the intrahepatic microcirculation
Acknowledgments
Financial Support: This work was supported by a grant from the Children’s Digestive Health and Nutrition Foundation and a K08 grant from the NIH.
List of abbreviations
- IRI
Ischemia Reperfusion Injury
- HFD
High Fat Diet
- RI
Resistive Index
- PI
Pulsatility Index
- H & E
Hematoxylin and Eosin
- VTI
Velocity Time Integral
- MIP
Maximum Intensity Profile
- ALT
Alanine Transaminase
- ROI
Region of Interest
Footnotes
Conflict of Interest Statement:
The authors declare that they have no conflicts of interest relevant to this work
VK: Designed and conducted the experiments, analyzed results and drafted the manuscript
RJ: Conducted the IRI surgeries and ultrasound measurements
CA: Analyzed the histology slides and did critical revisions to the manuscript
NG: Designed and directed the study with interpretation of data and critical revisions to the manuscript. Agrees to be accountable for all aspects of the work.
References
- 1.Chavin KD, Fiorini RN, Shafizadeh S, Cheng G, Wan C, Evans Z, Rodwell D, et al. Fatty acid synthase blockade protects steatotic livers from warm ischemia reperfusion injury and transplantation. Am J Transplant. 2004;4:1440–1447. doi: 10.1111/j.1600-6143.2004.00546.x. [DOI] [PubMed] [Google Scholar]
- 2.Fiorini RN, Shafizadeh SF, Polito C, Rodwell DW, Cheng G, Evans Z, Wan C, et al. Anti-endotoxin monoclonal antibodies are protective against hepatic ischemia/reperfusion injury in steatotic mice. Am J Transplant. 2004;4:1567–1573. doi: 10.1111/j.1600-6143.2004.00549.x. [DOI] [PubMed] [Google Scholar]
- 3.Gupta NA, Kolachala VL, Jiang R, Abramowsky C, Romero R, Fifadara N, Anania F, et al. The Glucagon-Like Peptide-1 Receptor Agonist, Exendin 4, Has a Protective Role in Ischemic Injury of Lean and Steatotic Liver by Inhibiting Cell Death and Stimulating Lipolysis. The American journal of pathology. 2012 doi: 10.1016/j.ajpath.2012.07.015. [DOI] [PMC free article] [PubMed] [Google Scholar]
- 4.Gupta NA, Kolachala VL, Jiang R, Abramowsky C, Shenoi A, Kosters A, Pavuluri H, et al. Mitigation of autophagy ameliorates hepatocellular damage following ischemia reperfusion injury in murine steatotic liver. Am J Physiol Gastrointest Liver Physiol. 2014 doi: 10.1152/ajpgi.00210.2014. [DOI] [PMC free article] [PubMed] [Google Scholar]
- 5.Seifalian AM, Piasecki C, Agarwal A, Davidson BR. The effect of graded steatosis on flow in the hepatic parenchymal microcirculation. Transplantation. 1999;68:780–784. doi: 10.1097/00007890-199909270-00009. [DOI] [PubMed] [Google Scholar]
- 6.Ijaz S, Yang W, Winslet MC, Seifalian AM. Impairment of hepatic microcirculation in fatty liver. Microcirculation (New York, NY: 1994) 2003;10:447–456. doi: 10.1038/sj.mn.7800206. [DOI] [PubMed] [Google Scholar]
- 7.Farrell GC, Teoh NC, McCuskey RS. Hepatic microcirculation in fatty liver disease. Anatomical record (Hoboken, NJ: 2007) 2008;291:684–692. doi: 10.1002/ar.20715. [DOI] [PubMed] [Google Scholar]
- 8.Gupta NA, Kolachala VL, Jiang R, Abramowsky C, Shenoi A, Kosters A, Pavuluri H, et al. Mitigation of autophagy ameliorates hepatocellular damage following ischemia-reperfusion injury in murine steatotic liver. Am J Physiol Gastrointest Liver Physiol. 2014;307:G1088–1099. doi: 10.1152/ajpgi.00210.2014. [DOI] [PMC free article] [PubMed] [Google Scholar]
- 9.Cox K, Sever A, Jones S, Weeks J, Mills P, Devalia H, Fish D, et al. Validation of a technique using microbubbles and contrast enhanced ultrasound (CEUS) to biopsy sentinel lymph nodes (SLN) in pre-operative breast cancer patients with a normal grey-scale axillary ultrasound. Eur J Surg Oncol. 2013;39:760–765. doi: 10.1016/j.ejso.2013.03.026. [DOI] [PubMed] [Google Scholar]
- 10.Hyvelin JM, Tardy I, Arbogast C, Costa M, Emmel P, Helbert A, Theraulaz M, et al. Use of ultrasound contrast agent microbubbles in preclinical research: recommendations for small animal imaging. Invest Radiol. 2013;48:570–583. doi: 10.1097/RLI.0b013e318289f854. [DOI] [PubMed] [Google Scholar]
- 11.Vlasin M, Lukac R, Kauerova Z, Kohout P, Masek J, Bartheldyova E, Koudelka S, et al. Specific contrast ultrasound using sterically stabilized microbubbles for early diagnosis of thromboembolic disease in a rabbit model. Can J Vet Res. 2014;78:133–139. [PMC free article] [PubMed] [Google Scholar]
- 12.Sullivan JC, Wang B, Boesen EI, D’Angelo G, Pollock JS, Pollock DM. Novel use of ultrasound to examine regional blood flow in the mouse kidney. Am J Physiol Renal Physiol. 2009;297:F228–235. doi: 10.1152/ajprenal.00016.2009. [DOI] [PMC free article] [PubMed] [Google Scholar]
- 13.Seifalian AM, Mallet SV, Rolles K, Davidson BR. Hepatic microcirculation during human orthotopic liver transplantation. Br J Surg. 1997;84:1391–1395. [PubMed] [Google Scholar]
- 14.Hakamada K, Sasaki M, Takahashi K, Umehara Y, Konn M. Sinusoidal flow block after warm ischemia in rats with diet-induced fatty liver. The Journal of surgical research. 1997;70:12–20. doi: 10.1006/jsre.1997.5077. [DOI] [PubMed] [Google Scholar]
- 15.Sato N, Eguchi H, Inoue A, Matsumura T, Kawano S, Kamada T. Hepatic microcirculation in Zucker fatty rats. Advances in experimental medicine and biology. 1986;200:477–483. doi: 10.1007/978-1-4684-5188-7_59. [DOI] [PubMed] [Google Scholar]
- 16.Teramoto K, Bowers JL, Kruskal JB, Clouse ME. Hepatic microcirculatory changes after reperfusion in fatty and normal liver transplantation in the rat. Transplantation. 1993;56:1076–1082. doi: 10.1097/00007890-199311000-00005. [DOI] [PubMed] [Google Scholar]
- 17.Ballet F. Hepatic circulation: potential for therapeutic intervention. Pharmacol Ther. 1990;47:281–328. doi: 10.1016/0163-7258(90)90091-F. [DOI] [PMC free article] [PubMed] [Google Scholar]
- 18.Terajima H, Thiaener A, Hammer C, Messmer K, Yamamoto Y, Yamaoka Y. Attenuation of hepatic microcirculatory failure during in situ xenogeneic rat liver perfusion by heat shock preconditioning. Transplantation proceedings. 2000;32:1111. doi: 10.1016/s0041-1345(00)01149-0. [DOI] [PubMed] [Google Scholar]
- 19.Villeneuve JP, Dagenais M, Huet PM, Lapointe R, Roy A, Marleau D. Clearance by the liver in cirrhosis. III. Propranolol uptake by the isolated perfused human liver. Can J Physiol Pharmacol. 1996;74:1327–1332. [PubMed] [Google Scholar]
- 20.Pasarin M, Abraldes JG, Rodriguez-Vilarrupla A, La Mura V, Garcia-Pagan JC, Bosch J. Insulin resistance and liver microcirculation in a rat model of early NAFLD. Journal of hepatology. 2011;55:1095–1102. doi: 10.1016/j.jhep.2011.01.053. [DOI] [PubMed] [Google Scholar]
- 21.Deshpande N, Lutz AM, Ren Y, Foygel K, Tian L, Schneider M, Pai R, et al. Quantification and monitoring of inflammation in murine inflammatory bowel disease with targeted contrast-enhanced US. Radiology. 2012;262:172–180. doi: 10.1148/radiol.11110323. [DOI] [PMC free article] [PubMed] [Google Scholar]
Associated Data
This section collects any data citations, data availability statements, or supplementary materials included in this article.


