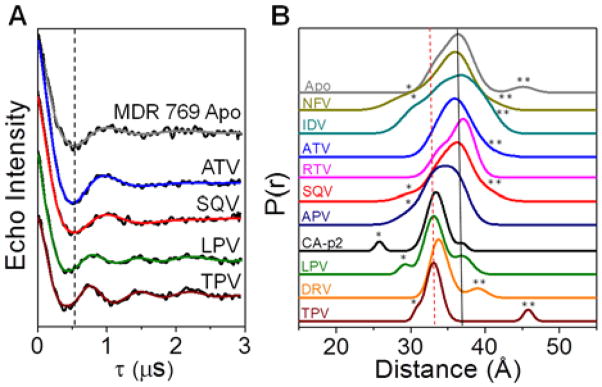
Figure 2.
(A) Background-subtracted DEER dipolar evolution curves (black) with fits from Tikhonov regularization (TKR) analysis for MDR769. Vertical dashed line marks the local minimum for Apo. (B) Stack plot of distance profiles for free MDR769 and with FDA-approved inhibitors or substrate-mimic, CA-p2. Semi-open and closed populations have flap distances of ~37 Å (black solid line) and ~33 Å (red dashed line), respectively. The minor population at ~26 – 30Å corresponds to the curled/tucked flap conformation (asterisk), whereas those at ~40 – 45 Å are assigned to the wide-open populations (double asterisk). Full details of data analyses are given in Supporting Information.

