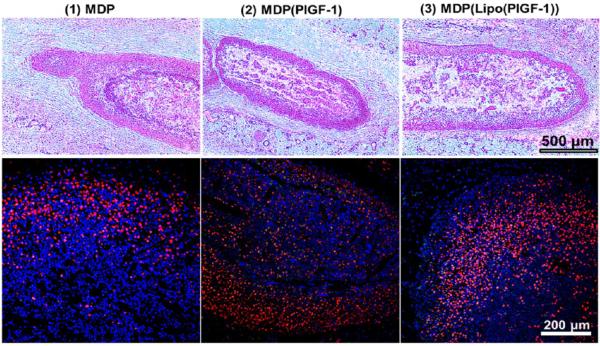
Figure 3.
Evaluation of cellular infiltrate. Top row: H&E images of subcutaneous implants in rats at day 2, showing rapid cellular infiltration (days 5 and 10 H&E images are shown in Figure S3); scale bar 500 μm. Bottom row: Immunostaining for monocytes/macrophages (CD68+; red) and nuclei (DAPI; blue) within the various implants at day 2. High macrophage infiltration can be seen in all cases (days 5 and 10 images are shown in Figures S4); scale bar 200 μm.

