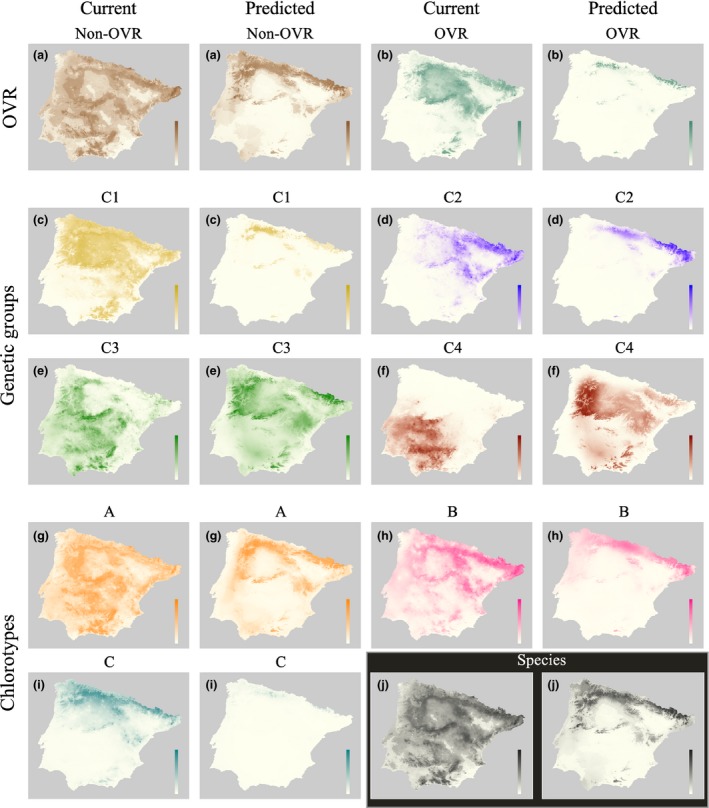
Figure 3.

Current and future potential distribution ranges for the species as a whole, phenotypic categories (OVR and non‐OVR), nuclear genetic clusters (C1, C2, C3, and C4), and chlorotype genetic groups (A, B, and C). Darker and lighter intensities for each color indicate higher and lower suitability, respectively.
