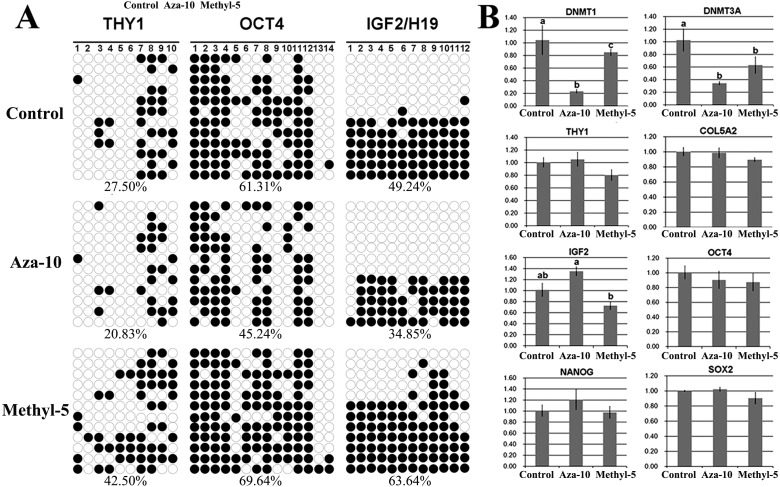
Fig. 2.
Specific gene methylation and transcription in PFFs. A, methylation status of Thy1, Oct4 and Igf2/H19 in PFFs after treatment with 10 nM 5-aza-dC (aza-10) or 5 µM 5-methyl-dCTP (methyl-5); B, relative transcription levels of specific genes in the aza-10 or methyl-5 group. The data are expressed as means ± SEM. a–c Values in columns for a given gene with different superscripts differ significantly (P < 0.05).

