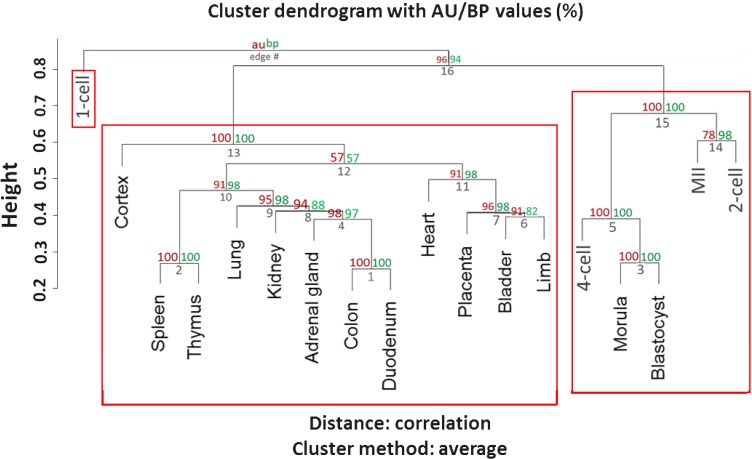
Fig. 1.
Hierarchical clustering of MII oocytes, preimplantation embryos, and 12 different tissues. The similarities of the gene expression patterns in MII stage oocytes, preimplantation embryos and 12 different tissues were analyzed by pvclust [10], which is an add-on package for the statistical software R. Genes with an RPKM value that were ranked in the top 2,000 were defined as actively expressed. For the 1-cell stage embryos, the RPKM values in introns were used to determine the top 2,000 active genes. In the pvclust analysis, the actively expressed genes were given a value of “1,” and the others were given a value of “0.” The values and branches represent approximately unbiased (AU) p-values (red), bootstrap probability values (green) and cluster labels (gray). Clusters are marked by red rectangles.

