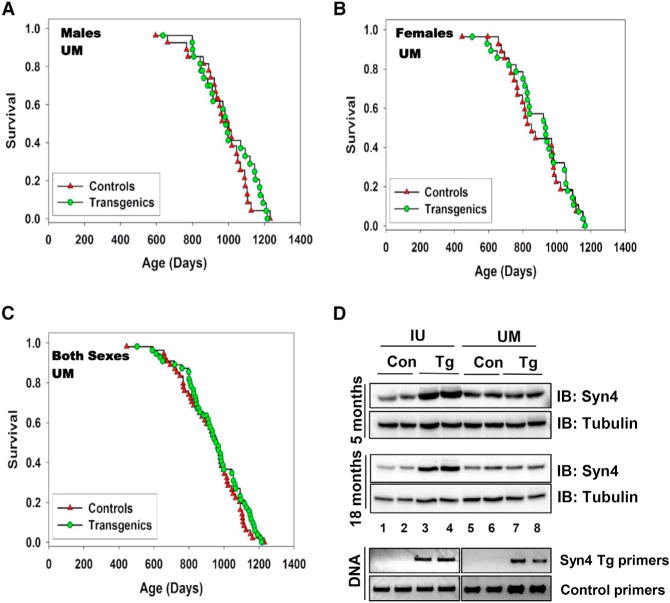
Figure 1. Lifespan and Syn4 Abundance in an Independent Colony of Syn4 Transgenic Mice.

Survival curves for mice in the Michigan (UM) cohort for (A) males (27 Tg and 27 Control; p = 0.46) and (B) females (27 Con and 28 Tg; p = 0.63) versus (C) both sexes pooled (55 Con and 56 Tg; p = 0.34). Statistical analyses were conducted using ANOVA. (D) Levels of transgene expression in male mice from IU versus UM cohorts in skeletal hindlimb muscle lysates (representative of n = 3/group for 5-month-old mice, n = 4/group for 18-month-old mice). Lysate proteins were resolved using 10% SDS-PAGE followed by transfer and immunoblot (IB) detection, and DNA genotyping was performed using Syn4 Tg primers (Oh et al., 2014). Tubulin served as the protein gel loading control. Equal quantities of PCR product were loaded per lane in the DNA gels, with control primers included to assess DNA quality and suitability for PCR analysis.
