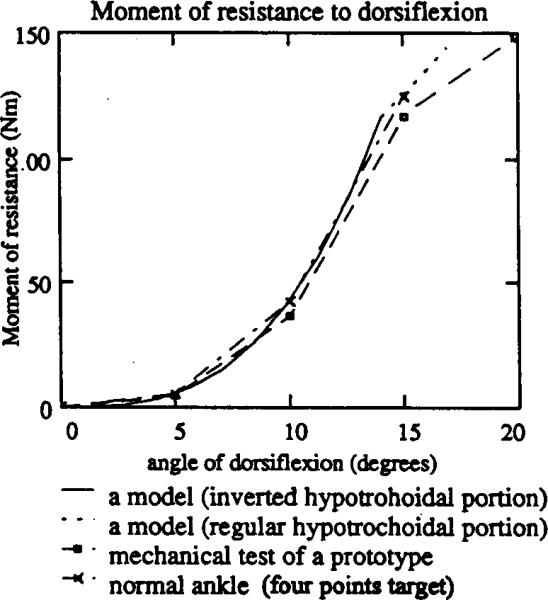
Fig. 6.
The resistive curves for the biomechanical target that is a typical normal gait pattern in the ankle joint (Fig. 1 (b)), for the RJA prototype and for the mathematical model (equation (9)). The curve of the RJA (mechanical tests) is in a reasonable agreement with the mathematical model, and with the nonlinear moment of resistance in the real ankle.

