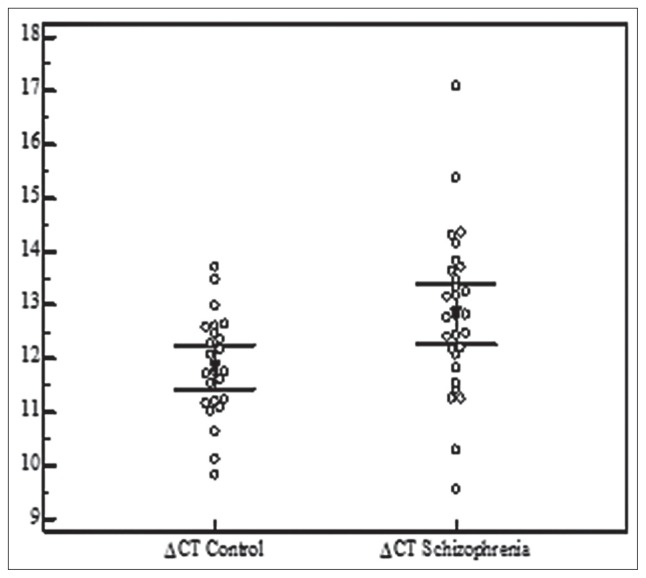
Figure 2.
The figure shows the ΔCt values of FEZ1 expression across the analyzed SZ patients and healthy controls compared with the cycle in which they were obtained. The qRT-PCR procedure was used to determine relative quantification levels of FEZ1 mRNA (RQ FEZ1) in peripheral blood from 29 patient samples.

