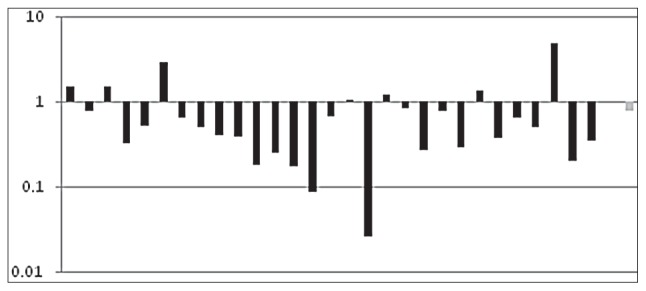
Figure 3.
Presentation of the results as fold changes in gene expression normalized to an endogenous reference gene relative to the healthy control patients.
Log transformed FEZ1 RQ of individual SZ subjects (in black), where 1 on the y-axis is average expression in controls. The average change of RQ level is shown in gray.

