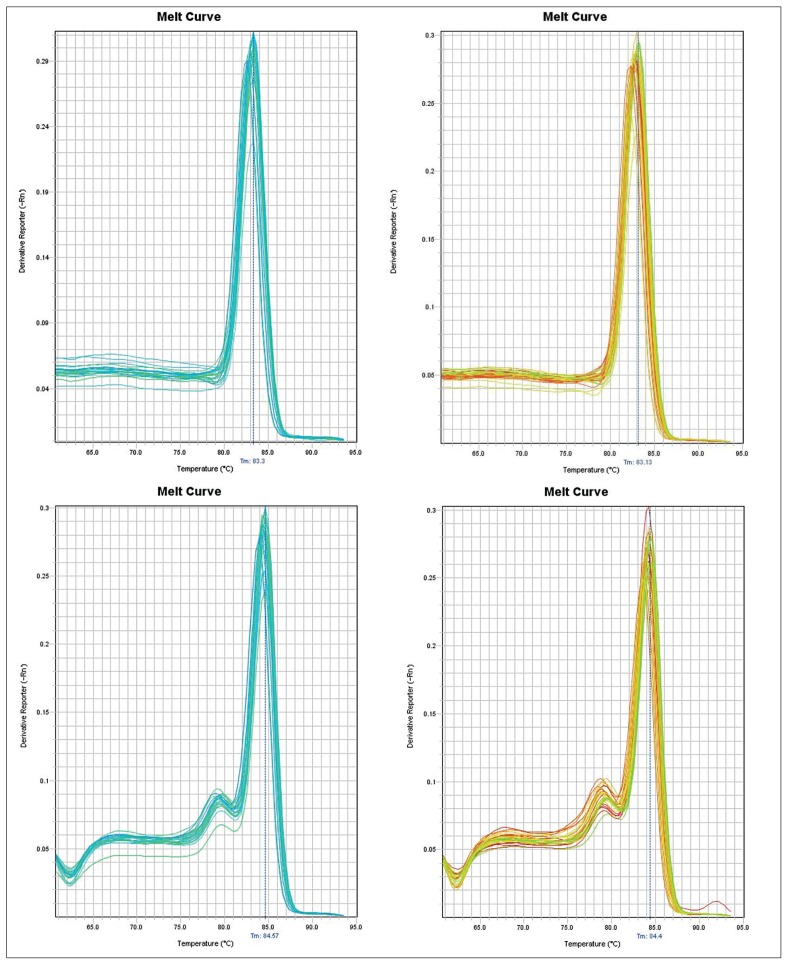
Figure 4.
The qRT-PCR data showing a DNA melt profile result for amplification of the specific single product in qRT-PCR analysis. Specific single products corresponding to ACTB in SZ and healthy control patients top panel and FEZ1 amplicons bottom panel, respectively, were confirmed by monitoring the dissociation curve (melting curve analysis). The melting dissociation, performed on FEZ1 and ACTB, allowed confirmation of the specificity of the amplifications. The melting temperatures of FEZ1 amplicons were 84 °C ± 1 °C, whereas ACTB had a melting temperature of 83 °C ± 1 °C.

