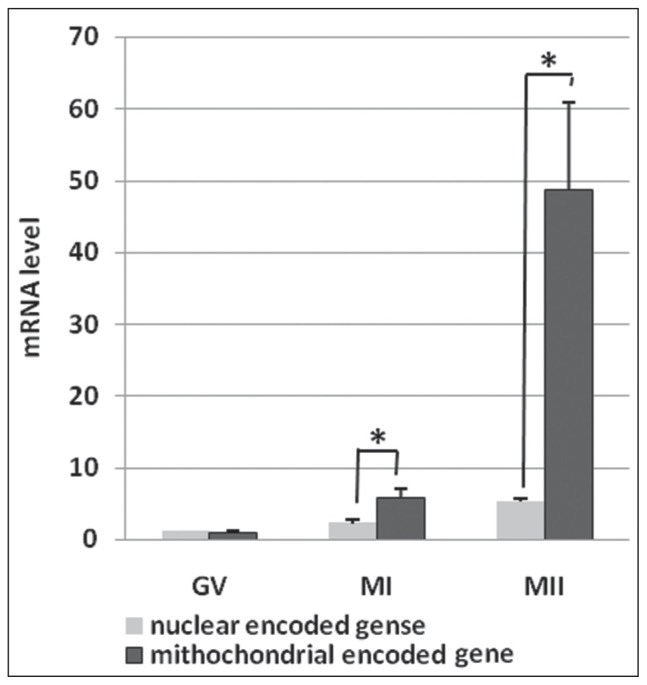
Figure 2.
Relationship between the mean relative expression levels of nuclear encoded (TFAM, NRF1) and the mitochondrial encoded (MT-CO1) genes at various stages of the human oocyte maturation. GV: p = 0.58; MI: p = 0.23; MII: p = 0.012.
Superscript asterisk (*) shows statically significant differences (<0.05). Data are presented as means ± standard deviation (SD).

