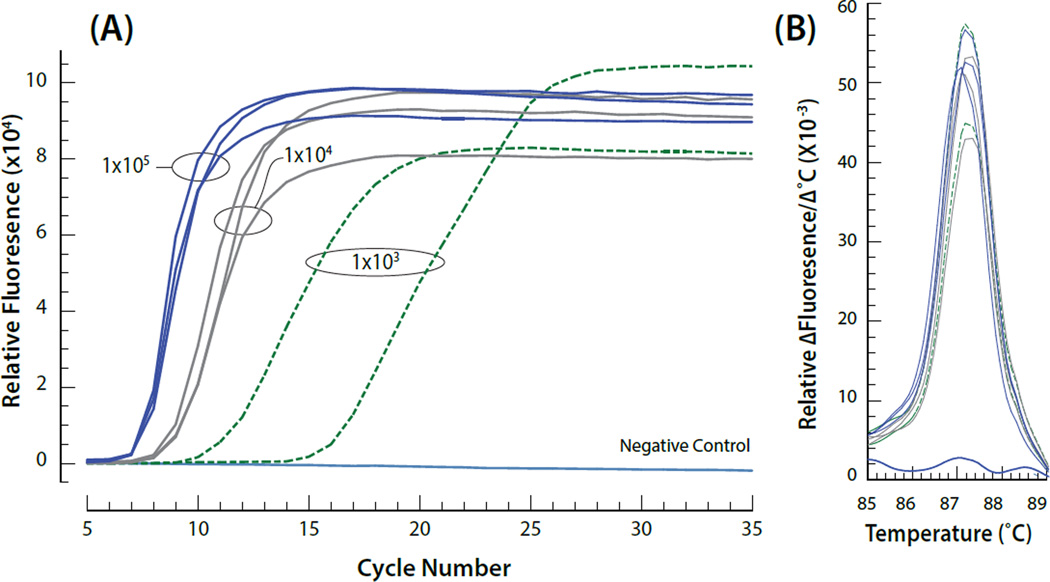
Figure 2.
(A) Examples of on-CARD real time RT-LAMP amplification as a function of different input viral concentrations. The viral particles/mL are indicated on the graph for each group of curves. Viral nucleic acid (RNA) was isolated and the resulting template amplified using LAMP entirely on the CARD cartridge (B) Annealing curves for the amplified target resulting from the different viral concentrations.

