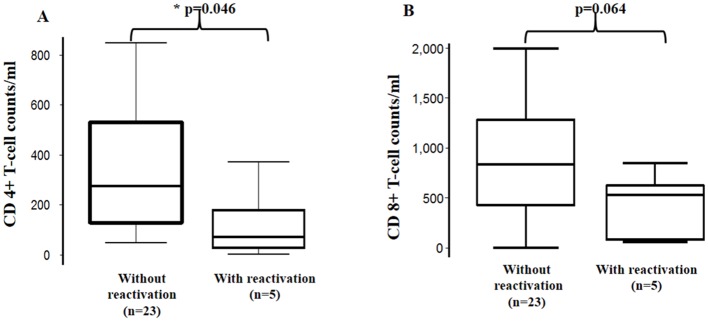
Fig 3. Counts of T-cell CD4+ and T-cell CD8+ in T. cruzi /HIV co-infected patients.
(A) T-cell CD4+ and (B) T-cell CD8+ cells. Bottom and top limits of the boxes correspond to first and third quartiles, and the line inside the boxes represents the second quartile (median). P-values were calculated using T-test with unequal variances. * Statistically significant difference.

