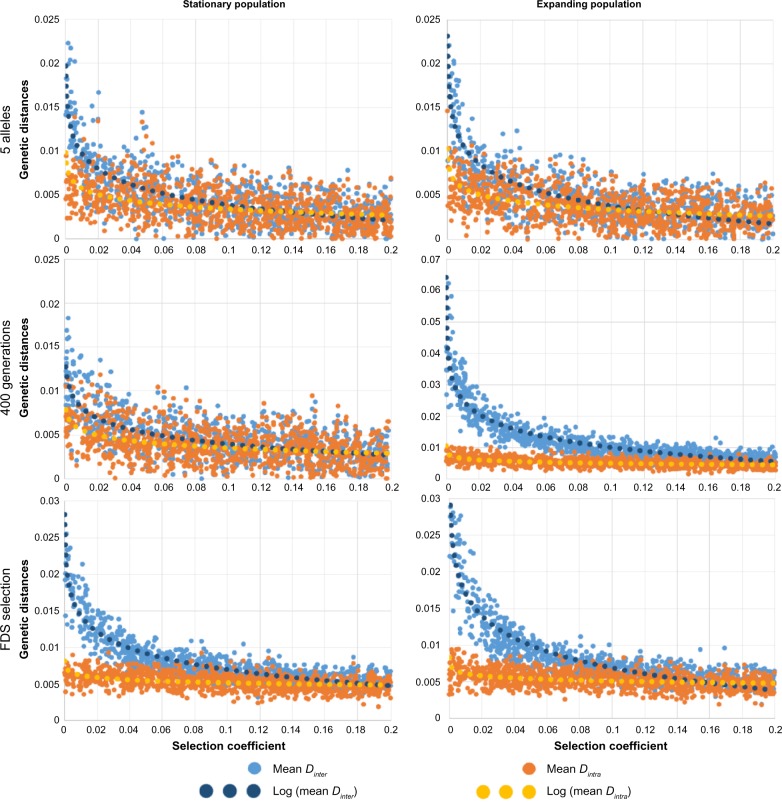
Figure 4.
Pairwise FST within population groups (in red) and between population groups (in blue) for 1,000 simulations and varying selection coefficients (symmetric HA). Dotted lines represent logarithmic regression lines. The left column shows the results for a stationary population, while the right column shows the results for an expanding population. All simulations have been obtained with the parameters Nmintra = 100, Nminter = 2.5 as in the first line of Figure 2. Only five alleles have been set in the first line (instead of 20 in Figure 2), 400 generations in the second line (instead of 2,000), and the FDS model for balancing selection in the third line (instead of SOS). Note the differences in the scale of the Y-axis in various graphs.

