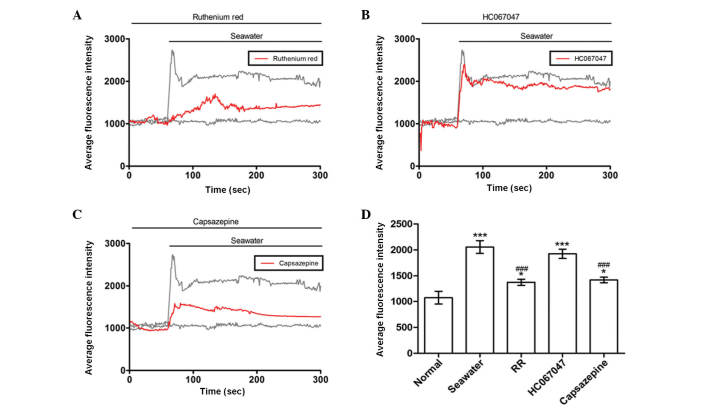
Figure 3.
Fluorescence intensity in A549 cells. Effect of (A) RR, (B) HC067047 and (C) capsazepine treatments on average fluorescence intensity in A549 cells. (D) Summary of average fluorescence intensities of each treatment group. *P<0.05 and ***P<0.001 vs. the normal group, ###P<0.001 vs. the seawater group. RR, ruthenium red.

