
Fig 3. Sch A inhibition of primary microglia activation induced by LPS and protection of neurons from microglia-mediated inflammatory injury.
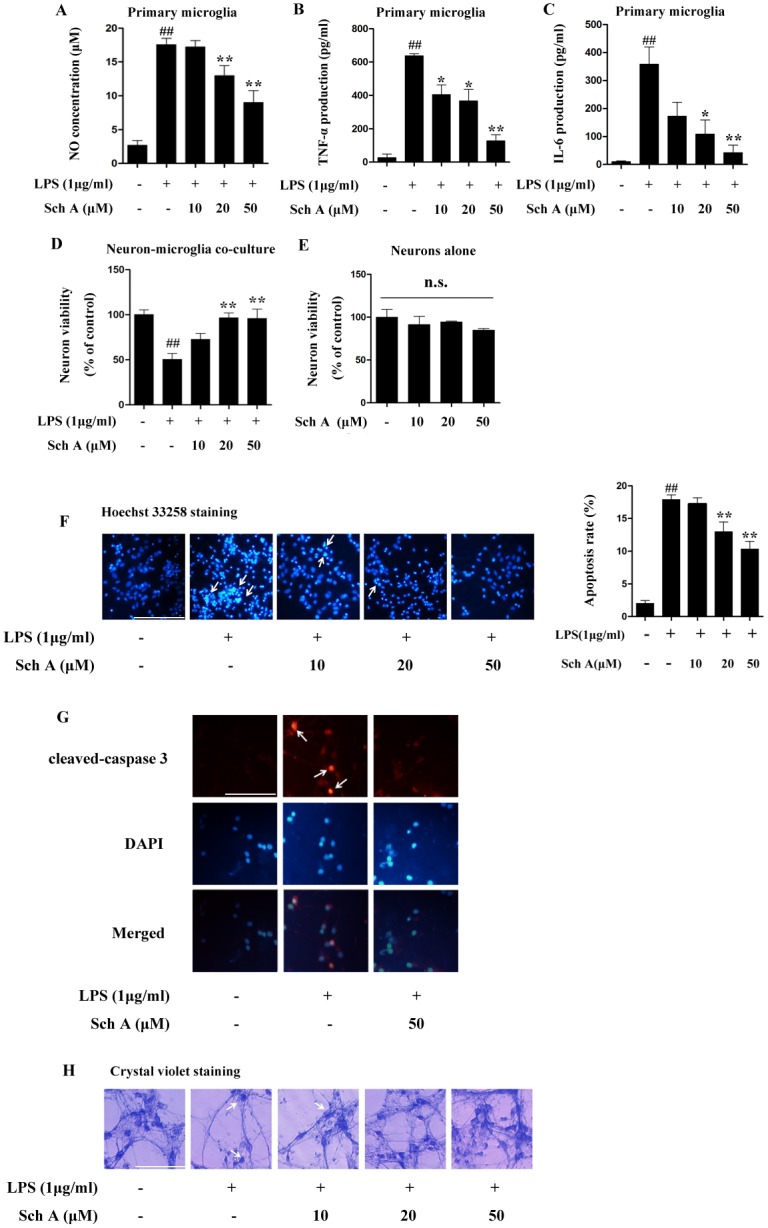
(A) Primary microglia cells were treated with LPS (1 μg/ml) with or without Sch A (10, 20 and 50 μM) for 24 h, followed by analysis of NO production. (B) Primary microglia cells were treated with LPS (1 μg/ml) with or without Sch A (10, 20 and 50 μM) for 4 h, and then TNF-α expression was analyzed by ELISA. (C) Primary microglia cells were treated with LPS (1 μg/ml) with or without Sch A (10, 20 and 50 μM) for 8 h, and then IL-6 expression was analyzed by ELISA. (D) Primary neuron viability was tested using the MTT assay after treatment with conditioned medium and induction by LPS (1 μg/ml) with or without Sch A (10, 20 and 50 μM) for 24 h. (E) After primary neurons were treated with or without Sch A (10, 20 and 50 μM) for 24 h, cell viability was determined by the MTT assay. (F) After primary neurons were incubated with conditioned medium and stimulated by LPS (1 μg/ml) with or without Sch A (10, 20 and 50 μM) for 24 h, Hoechst33258 staining was performed to assess cellular apoptosis. Typical apoptotic cells are marked by arrows (bar = 100 μm). Apoptosis rate = number of positive cells/total number of cells × 100% (G) After primary neurons were incubated with conditioned medium and induced by LPS (1 μg/ml) with or without Sch A (50 μM) for 24 h, cleaved caspase 3 was detected by immunofluorescence. Red fluorescence represents cleaved caspase 3, and blue fluorescence represents nuclear DAPI staining (bar = 100 μm). (H) After primary neurons were incubated with conditioned medium and induced by LPS (1 μg/ml) with or without Sch A (10, 20 and 50 μM) for 24 h, crystal violet staining was performed to observe changes in morphology. Typical apoptotic cell are marked by arrows (bar = 100 μm). All data are shown as the mean ± S.D. from independent experiments performed in triplicate. ##P < 0.01 relative to control group; *P < 0.05, **P < 0.01 relative to LPS group.