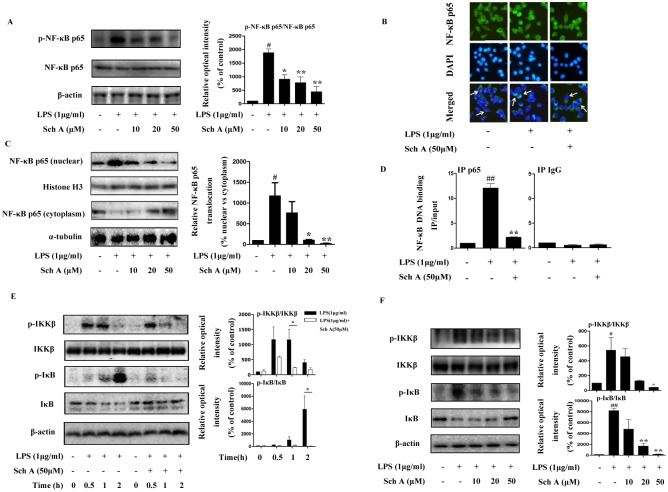
Fig 4. Sch A inhibition of NF-κB pathway activation in LPS-induced BV-2 cells.
(A) BV-2 cells were treated with LPS (1 μg/ml) with or without Sch A (10, 20 and 50 μM) for 2 h, followed by analysis of NF-κB p65 phosphorylation by Western blot. (B) BV-2 cells were treated with LPS (1 μg/ml) with or without Sch A (50 μM) for 2 h, followed by detection of the NF-κB p65 subunit translocation by immunocytochemistry. Green fluorescence represents the NF-κB p65 subunit, and blue fluorescence represents nuclear DAPI staining (bar = 50 μm). (C) After BV-2 cells were treated with LPS (1 μg/ml) with or without Sch A (10, 20 and 50 μM) for 2 h, NF-κB p65 levels in the nucleus and cytoplasm were determined by Western blot. Histone H3 and α-tubulin were used as endogenous controls for nuclear and cytoplasmic proteins, respectively. (D) After BV-2 cells were treated with LPS (1 μg/ml) with or without Sch A (50 μM) for 2h. Cell lysates were prepared for chromatin immunoprecipitation for NF-κB p65, samples were amplified by quantitative PCR with primers for the promoter of iNOS. (E) BV-2 cells were treated with LPS (1 μg/ml) with or without Sch A (50 μM) for 0, 0.5, 1 and 2 h. The phosphorylated and total IKKβ and IκB proteins at different time points were determined by Western blot. (F) After BV-2 cells were treated with LPS (1 μg/ml) with or without Sch A (10, 20 and 50 μM) for 0.5 h (p-IKKβ assay) or 1 h (p-IκB assay), the phosphorylated and total IKKβ and IκB proteins were determined by Western blot. All data are shown as the mean ± S.D. from independent experiments performed in triplicate. #P < 0.05, ##P < 0.01 relative to control group; *P < 0.05, **P < 0.01 relative to LPS group.

