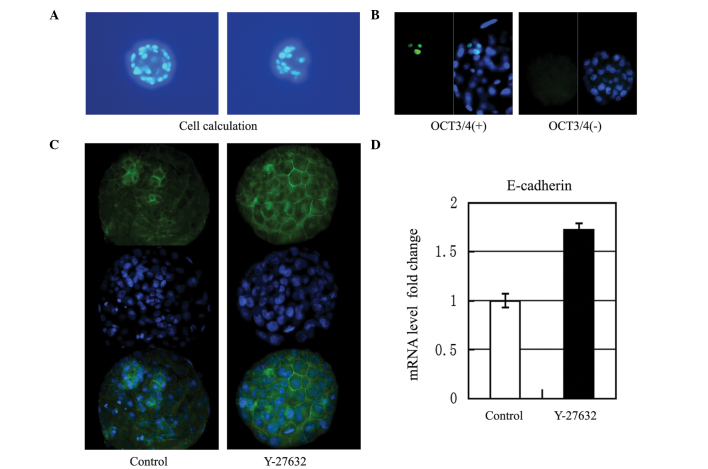
Figure 3.
Effect of Y-27632 on single blastomeres. (A) Nuclei were counterstained with Hoechst-33342 to count the number of cells. (B) Representative examples of immunocytochemical staining against OCT3/4. (C) Representative examples of the protein expression levels of E-cadherin, determined using immunofluorescence in the experimental group and control group. The three images of each group were E-cadherin expression alone (green), stained with DAPI alone (blue) and the combined image. Culture of blastomeres in the presence of 10 µM Y-27632 resulted in upregulation of the expression of E-cadherin. (D) Effects of Y-27632 on the mRNA expression of E-cadherin. E-cadherin mRNA levels were measured using reverse transcription-quantitative polymerase chain reaction analysis. Quantitative results were standardized to the levels of GAPDH and presented as the fold change over the control group (P=0.22, vs. control). OCT3/4, octamer-binding transcription factor.

