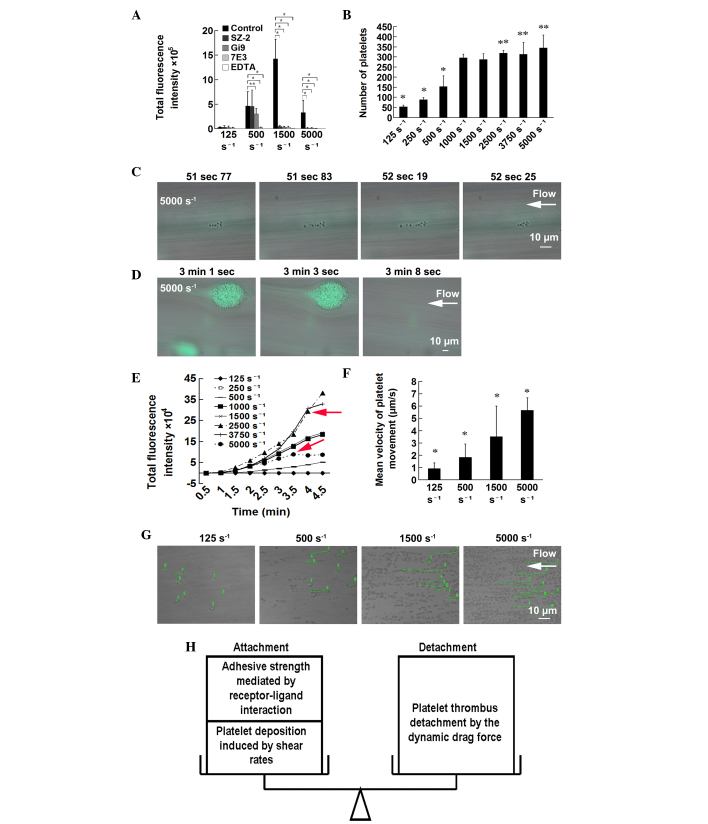
Figure 5.
Underlying mechanisms for thrombus formation at different WSRs. (A) Adhesive receptors assist in resisting the drag force imposed by flow. Whole blood was pretreated with no antagonist (control), with calcium chelating agents (EDTA), anti-GPIb (SZ-2), anti-α2β1 (Gi9) and anti-αIIbβ3 (7E3) antibodies. Results are presented as the mean ± standard deviation from 30–45 randomly-selected fields of three independent experiments from three donors. *P<0.01 and **P<0.05. (B) Elevated WSRs caused platelet deposition. Whole blood was perfused over a von Willebrand factor-coated surface at indicated WSRs. The number of adhesive platelets was counted. Results are presented as the mean ± standard deviation from at least eight randomly-selected fields of four independent experiments from three donors. (C–G) Elevated WSRs led to shedding of thrombi. *P<0.01 and **P<0.05, compared with that at 1,500 s−1. (C) Platelets downstream, tethered to the head of the thrombi, were detached at 5,000 s−1. (D) At 5,000 s−1, two thrombi were gradually shed. (E) Fluorescence images were captured every 30 sec. In order to reduce the bleaching of fluorescence, a 4X long-working-distance objective was used, laser intensity was reduced to 1/16 of that mentioned above, and exposure time was extended. The thrombi progressively accumulated with time at all WSRs, with the exception of 5,000 and 3,750 s−1, at which the curve exhibited a sharp turn at ~3.5–4 min (red arrows). *P<0.01 and **P<0.05, compared with that at 1,500 s−1. The (G) mean velocity of movement of eight randomly-selected platelets was calculated. (F) Platelet tracking path lines of the randomly selected platelets at different WSRs are shown in green lines with assigned numbers. Results are representative of three independent experiments. (H) Schematic diagram of the attachment-detachment balance. WSR, wall shear rate.

