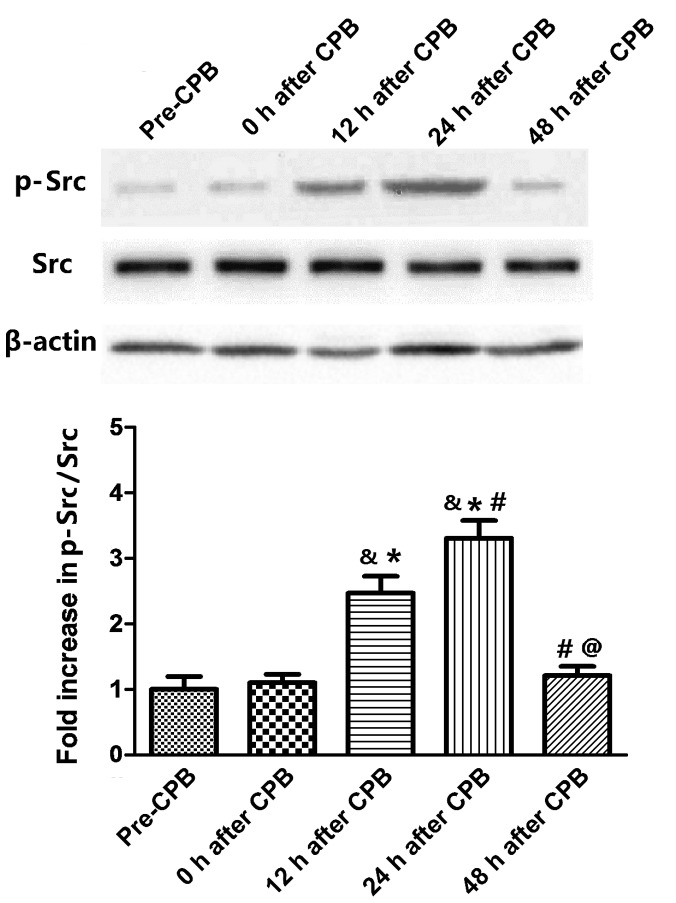
Figure 3.
Western blot analysis of Src phosphorylation in the lung tissues. Treatments have been described in Fig. 1. &P<0.05, compared with the pre-CPB group; *P<0.05, compared with 0 h after CPB; #P<0.05, compared with 12 h after CPB; @P<0.05 compared with 24 h after CPB. CPB, cardiopulmonary bypass.

