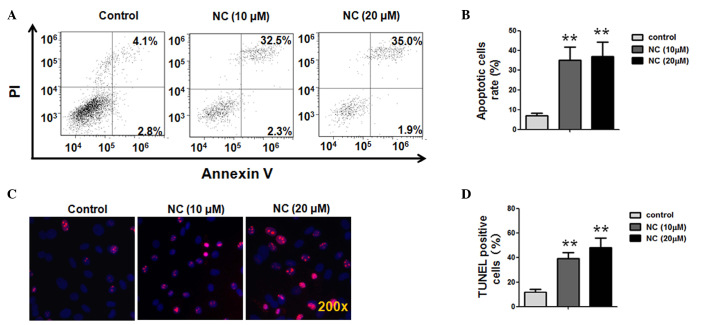
Figure 2.
NC induced dose-dependent apoptosis in HCT116 cells. (A) The HCT116 cells were treated with NC (0, 10 and 20 µM) for 24 h and then double-stained with PI and annexin V. The cells were analyzed using a flow cytometer. (B) The bar graph represents the results of three independent experiments. (C) The HCT116 cells were treated with NC (0, 10 and 20 µM) for 24 h and then stained with DAPI and TUNEL, which labeled the 3′-OH ends of the fragmented DNA in apoptotic cells, and were viewed using a confocal microscope (magnification, x200). (D) Quantification of the percentage of TUNEL positive cells. The bar graph represents the results of three independent experiments. **P<0.01 vs. the control group. NC, nitidine chloride; PI, propidium iodide; DAPI, 4′,6-diamidino-2-phenylindole; TUNEL, terminal deoxynucleotidyl transferase dUTP nick end labeling.

