Figure 3.
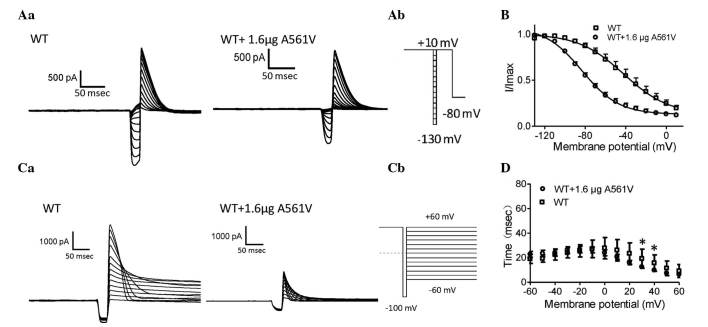
Steady-state inactivation and time courses of inactivation analysis. (Aa) Representative steady-state inactivation current traces. (Ab) A portion of the voltage-clamp protocol. (B) Normalized steady-state inactivation curves for WT-hERG and 1.6-µg A561V-transfected WT-hERG cells, respectively. (Ca) Representative current traces of the time courses of inactivation and inactivation time constant values (τ) for WT-hERG and 1.6-µg A561V-transfected WT-hERG cells. (Cb) A portion of the voltage-clamp protocol. (D) Normalized inactivation time constant, τ, in cells expressing WT-hERG and 1.6-µg A561V-transfected WT-hERG cells. τ was measured by fitting the inactivating currents, during test pulses at each potential, with a single exponential function. *P<0.05, WT vs. A561V-transfected WT group. WT, wild-type; hERG, human ether-à-go-go-related gene; I, current; V, voltage.

