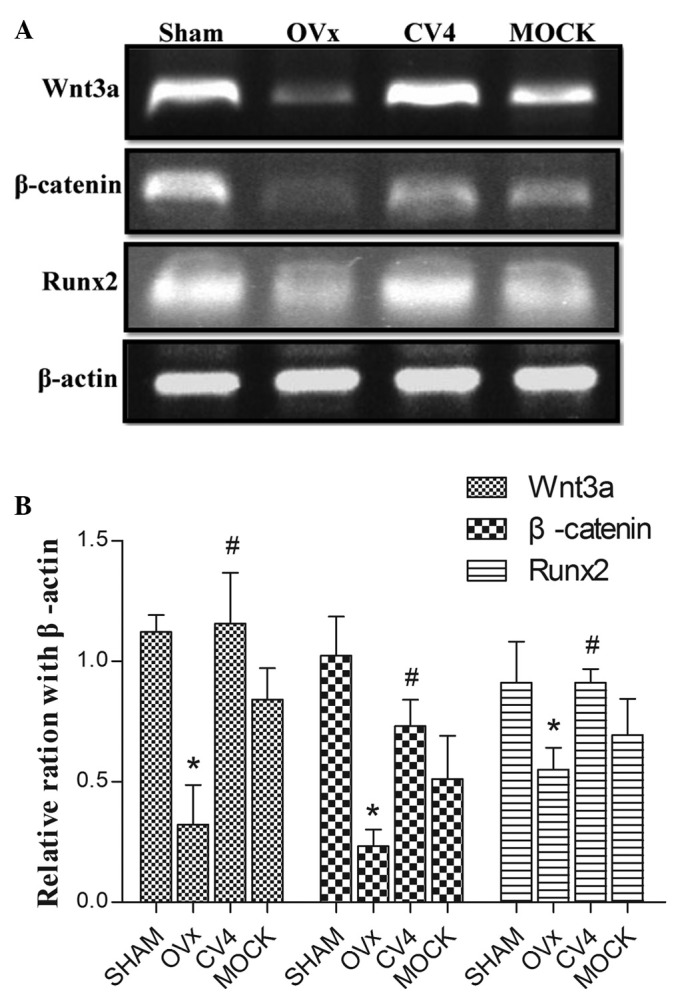
Figure 3.

(A) mRNA expression levels of Wnt3a, β-catenin and Runx2 in different experimental groups. β-actin was used as an internal control for RT-PCR. (B) The quantified RT-PCR data are presented as the gray values of different groups. *P<0.05 versus Sham; #P<0.05 versus OVx. Experiments were performed in triplicate and similar results were obtained. OVx, ovariectomy; RT-PCR, reverse transcription-polymerase chain reaction.
