Figure 2.
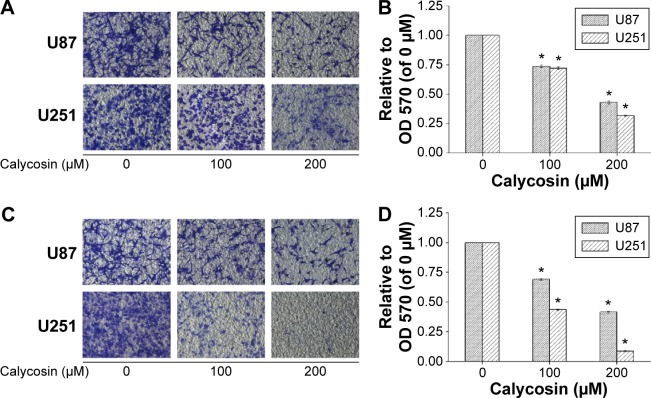
Inhibitory effects of calycosin on cell migration and invasion.
Notes: (A) Cells were treated with indicated concentrations of calycosin for 18 hours. The representative images of migrate cells at the bottom of the membrane stained with crystal violet were visualized. (B) The stained cells were eluted by 33% glacial acetic acid for 20 minutes. The elution was measured at 570 nm to obtain the OD 570 values, and normalized to that of control. (C) Cells were incubated with indicated concentrations of calycosin for 24 hours. Photographs are of the cell invasion through the polycarbonate membrane stained by crystal violet. (D) Each treatment had three replicates. All tests were performed in triplicate and presented as mean ± standard deviation. *P<0.05, compared with control (0 μM).
Abbreviation: OD, optical density.

