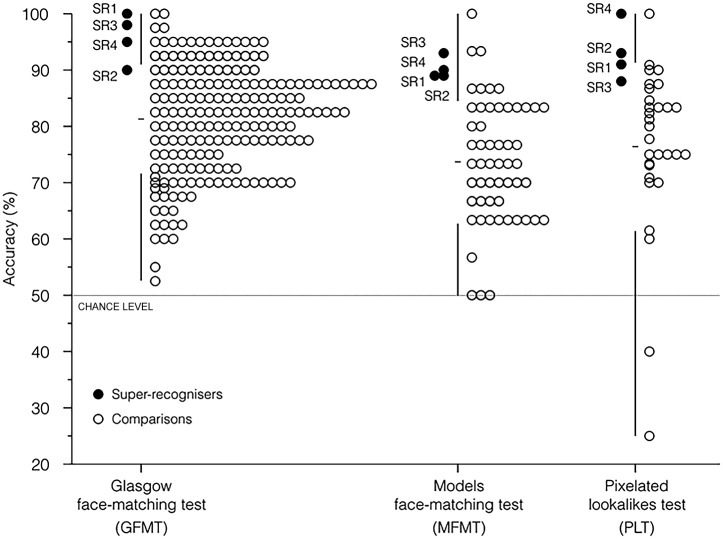
Fig 2. Performance of police super-recognisers and comparison viewers.
Performance of super-recognisers (SR1–4; black) and comparison viewers (white) on three different tests of face recognition—the GFMT (left column), the MFMT (middle column), and the PLT (right column). Vertical lines indicate the range of scores for comparison groups, the deleted portion of the line shows the standard deviation, and the horizontal notch shows the mean. In all three tasks, chance performance is 50%.

