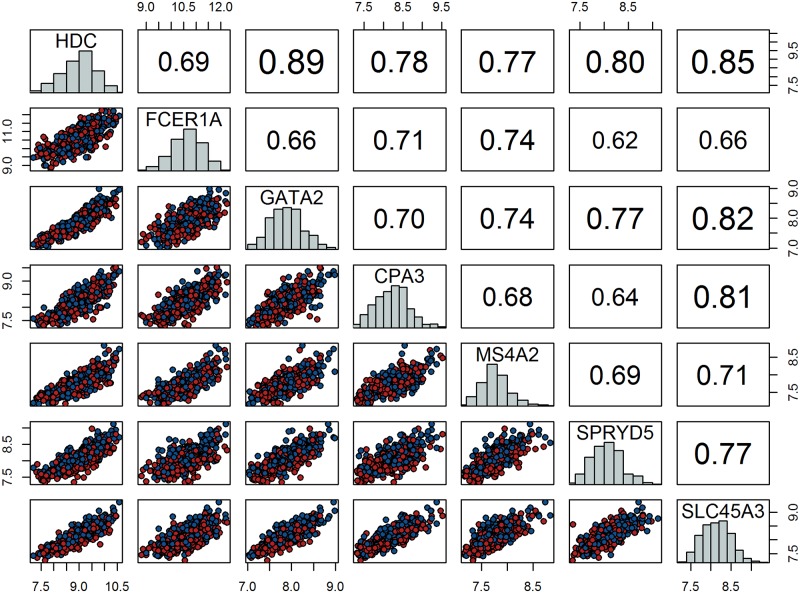
Fig 2. Scatter-plot matrix of the core LL module gene expression values.
Scatter-plots of the expression values for each gene pair appear in the lower triangular matrix. Points are colour coded by gender: red represents males and blue represents females. Pairwise Spearman’s correlation coefficients are indicated in the upper triangular matrix. The distribution of gene expression values for each gene is illustrated on the main diagonal.

